
|
|
1.IntroductionPositron emission tomography (PET) is the most specific and sensitive means for imaging molecular interactions and pathways within the human body.1 The specificity arises from the range of positron-emitting radionuclides, which can be used to label specific biomarkers, biochemicals, and pharmaceuticals without disturbing their biological function. In addition, radiation emitted from a radiolabeled tracer is specific to that tracer and can be detected above the low natural radiation background. The main confounding factors are the requirements to correct for the effect of scatter and the attenuation of photons by the tissue. These two aspects are fundamental to effecting the tracer principle for which George de Hevesy received the Nobel Prize in chemistry in 1943. The sensitivity of PET is the ability to detect low molecular mass of the tracer, which depends on two factors. The first is the ability of the radiochemistry to produce labeled compounds with high specific activity, namely the measured radioactivity per gram of compound, so that a high percentage of the injected compound is radiolabeled. The second factor is the ability to detect and localize the positron-emitting nuclei by using coincidence counting to capture the paired annihilation photons emitted following positron annihilation with an electron. Over the course of the last 60 plus years, coincidence detection of positron-emitting radionuclides has evolved from single pairs of detectors for planar imaging to current PET scanners with arrays of detector elements covering typically 25 cm or more, in axial length and contain the order of 35,000 individual detector elements. Currently, the first total-body PET scanner, the EXPLORER, is being built, which is 2 m in axial length and contains 560,000 individual detector elements,2 some 10 times those in commercial scanners. From the early scanners of the 1960s to the EXPLORER under construction today, the objective is always to improve the sensitivity so as to maximize the acquired counts per unit of radiation dose to the patient and achieve high spatial and temporal resolutions. Developments have centered on improvements in the scintillator crystal and photodetector combination, the acquisition electronics and advances in data processing, reconstruction and image analysis. A primary factor contributing to improved sensitivity is the axial coverage of the scanner that has increased from 2 cm in the early systems (ECAT II) to 25 cm in the most advanced scanners available today. Since 2001, essentially all PET scanners are physically combined with an anatomical imaging device such as a CT or, from 2010, an MR scanner. The second modality not only provides a high spatial resolution anatomical framework that is accurately coregistered with the functional PET image, but also can be used to improve the quality of the PET image. Historically, the development of clinical PET/CT occurred in the mid-1990s, around the time when the concept of preclinical PET/MR was being explored. Subsequently, clinical PET/CT translated into a preclinical PET/CT device while, sometime later, the preclinical PET/MR designs became a reality in the clinical domain. The point that will be emphasized in this review is that systematic advances in PET scanner technology have resulted in a factor of 40 increase in sensitivity from the very early single-slice designs to the commercial scanners of today. Inevitably, each new phase in this progression has come at additional cost, although this has been offset by an increase in the acquired signal per unit of cost, resulting in potential new clinical and research applications. Following the agreement in 1998 of Medicare to reimburse for some cancer indications in the United States, commercial competition among vendors of PET instrumentation also helped to contain the cost of the development. Based on that past experience, and given the increasing and foreseen wider use of whole-body PET, it is anticipated that the introduction of new PET scanner technology will meet this growing challenge by an increase in sensitivity of a factor of 40 for whole-body imaging. It is predicted that this future technology will be widely adopted, resulting in new applications of PET in clinical research and healthcare and thereby realizing the full potential of this imaging modality. To achieve this goal, innovation will be required of physicists and engineers encouraged and stimulated by new applications encompassing a whole-body, “systems biology” approach for exploiting the uniqueness of PET-based molecular imaging. While the technical advances in PET instrumentation are the main subject of this review, the corresponding advances in clinical research and healthcare will be summarized with reference to appropriate reviews. PET has an extensive and far-reaching history, and any review cannot cover all aspects due to space limitations. This review is therefore, by necessity, incomplete although every attempt has been made to include significant milestones in the technological development. For a recent comprehensive review of PET technology, image reconstruction, and applications, see Ref. 3. 2.Setting the Scene: Positron Emission Tomography Coincidence Detection MethodsTwo initial reports of the opportunities offered by the use of coincidence detection of positron capture in medicine were published independently in 1951. Wrenn et al.4 from Duke University suggested the use of coincidence detection, whereas Sweet5 from Boston referred to it in a more general report on the use of nuclear disintegrations in the diagnosis and treatment of brain tumors. A detailed publication on the application of the coincidence detection for localizing brain tumors was published by Brownell and Sweet from Massachusetts General Hospital (MGH) in 1953.6 A pair of sodium iodide detectors [Fig. 1(a)], operating in coincidence, were placed on either side of the head and scanned rectilinearly to derive the distribution of the radioactivity. The application was to image the underlying distribution of the positron emitter , which leaks into the disrupted blood brain barrier caused by the tumor, as shown in Fig. 1(b). Fig 1(A) First clinical positron imaging device developed in 1953 by Dr. Brownell (left) and Dr. Aronow (right), and (B) the coincidence and unbalance scans of patient with recurring brain tumor. The coincidence scan (a) of a patient showing recurrence of a tumor under the previous operation site, and unbalance scan (b) showing asymmetry to the left. [Reproduced from Ref. 6]. 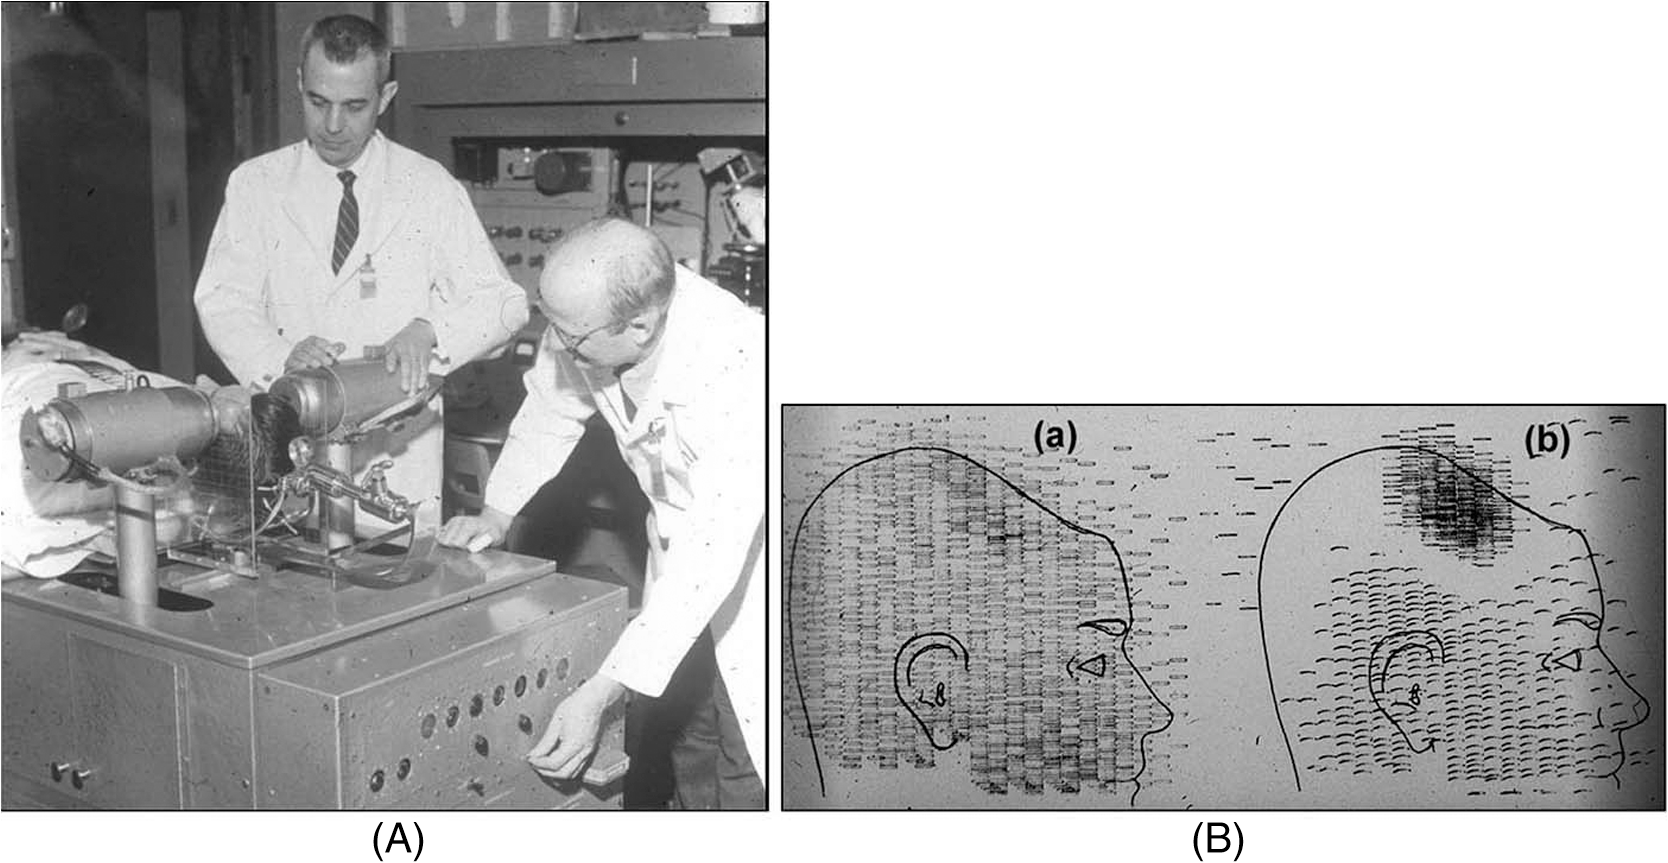 In 1961, a group at Brookhaven National Laboratory developed a ring of 32 sodium iodide-based coincidence detectors surrounding the head.7 At the Donner Laboratory of the University of California, Berkeley, Anger,8 who invented the gamma camera, used it in coincidence with a reference detector. By the late 1960s, the MGH group led by Brownell9 had developed what they termed the hybrid scanner by constructing static two-dimensional (2-D) arrays of individual coincident detectors to view the brain. The image, while still primarily 2-D, was recorded with much increased sensitivity over the single pair of scanning probes. The MGH group went on to develop a device known as the positron camera shown in Fig. 2, that had a field of view of , which became operational in the early 1970s.10 A unique feature of the design, devised by Burnham and Brownell10, was a coding scheme that allowed small sodium iodide crystals to be encoded by fewer, larger photomultipliers, thereby reducing cost and improving spatial resolution. 3.Instrumentation for Tomographic Imaging of Positron Emission: Early DesignsThe announcement of the invention by Hounsfield11 of a method for x-ray computerized tomography,12 for which he shared the 1979 Nobel Prize in physiology and medicine with Cormack, vividly illustrated the power of tomographic imaging. Transaxial single photon emission computerized tomography (SPECT) had been explored extensively by Kuhl et al.13,14 in the 1960s and early 1970s. Their work and others’ work, notably Budinger and Gullberg15 using the Anger camera, were an appreciable stimulus to extend this approach to positron-emitting radioisotopes. Chesler rotated the MGH positron camera to record multiple views, which were then filtered and back projected to obtain transaxial tomographic images. Chesler also recorded a transmission image using an external source of which provided, for each projection, an accurate attenuation correction for every line-of-response between coincidence detectors. This provided the means for avoiding distortion in the reconstructed image as well as offering a means to derive quantitative values for tissue concentrations of radioisotopes. He initially presented this method at the 18th SNM annual meeting in 1971 in Los Angeles, California16 and, in more detail, at a meeting on Tomographic Imaging in Nuclear Medicine in 1972, the proceedings of which were published in 1973.17 Here, he specifically compared his computational method of removing out-of-plane activity with conventional tomography, where the activity was blurred but not removed. Also in 1973, Chesler18 presented tomographic images of myocardium perfusion. In these initial publications, the ability to quantify the regional tissue concentration of tracer in absolute units was not reported. In retrospect, this is assumed to be due to the sensitivity of the open positron camera design to recording high levels of random and scattered coincidences, which at the time could not be corrected for owing to the lack of delayed electronic circuitry to monitor and acquire randoms, and an effective scatter correction technique. An improved version of the positron camera, was designed specifically for tomographic imaging and later commercialized. The next major contribution in instrumentation was a development in St. Louis, Missouri, around 1974 when Ter-Pogossian, Phelps, Hoffman, and Mullani readdressed the physical characteristics of a positron tomograph to ensure the ability to quantify regional concentrations of the tracer in tissue. They focused on optimizing the physical design of the scanner to minimize the registration of unwanted coincidences that arise due to contributions from random coincidences and scattered events, as well as dead time losses from the high flux of incident gamma rays on the detectors. To meet these challenges, a hexagonal array of sodium iodide scintillation detectors was constructed surrounding a single transaxial plane, protected by heavy side shielding. As in the case of the MGH positron camera, they placed lead, iris-like apertures over the front of each detector to improve the spatial resolution. To ensure adequate within-plane sampling, they also followed the practice of the MGH group of physically moving, in discrete steps, the detector heads one intercrystal distance and incrementally rotated the assembly around the transaxial plane.19,20 This system was termed positron emission transaxial tomography (PETT). It is worth noting that, while the MGH design acquired a 30-cm axial field of view tomographically, the need to rotate the gantry through 180 deg was a disadvantage compared to the single transaxial plane scanner, which only had to rotate through 60 deg. Furthermore, because of the more open design, the MGH positron camera registered high levels of scattered and random coincidences, and operated with high dead time. It has only been since the introduction of a faster scintillator and the development of methodology for correcting for scattered coincidences that a more open field-of-view and increased axial length have become feasible, leading to the current, state-of-the-art, quantitative PET scanners. The group in St. Louis specifically minimized the contribution of scattered coincidences acquired in their scanner design and were thus able to report the ability to make quantitative measurements of the regional tissue concentration of a positron-emitting radionuclide.21,22 These quantitative measurements have proved to be an important property of PET, where the tissue uptake obtained from the image voxels can be calibrated in absolute units of radioactivity. This can be achieved by cross calibrating a phantom, filled with radioactive fluid, which is imaged in the scanner and with aliquot samples taken from the phantom and measured in a well-counter or dose calibrator. The tissue concentration of tracer can then be measured in the same units as the administered dose, as measured in a dose calibrator. The blood concentration of the tracer can be obtained from blood pool regions within the image, or from well counter measured blood samples taken from the patient, although the latter procedure is more invasive. From this set of calibrated measurements (injected dose, blood, and tissue concentration), the biodistribution of the tracer can be quantified in relation to administered dose and blood concentrations. By acquiring a set of serial time frames during the uptake of the tracer, the kinetics of exchange of tracer between the blood and the tissue can be modeled to derive values of the rate constants of exchange. Such constants relate directly to the metabolic rates of the biological pathways being traced and the active density of the molecular sites of exchange within the tissue. The capability of PET to make such absolute measurements in vivo and noninvasively is unique and a major strength of the modality for clinical research and healthcare. Following their move from St. Louis to join Kuhl in Philadelphia, Phelps and Hoffman collaborated with Douglass and Williams at the EG & G ORTEC, a company based in Oak Ridge, Tennessee. The major achievement of this collaboration was a commercial, single transaxial plane PET scanner known as the emission computerized axial tomograph, the ECAT I, which also consisted of a hexagonal array of detectors. The first version of this commercial design was installed at UCLA in Los Angeles [Fig. 3(b)] where convincing brain images recorded with were demonstrated.23 This device was later upgraded to ECAT II,24 shown schematically in Fig. 3(a) that was purchased by a number of centers in Europe, the USA, and Japan that were already equipped with cyclotrons. The design served to initiate a number of PET-based clinical research programs using a standardized, commercially supported PET scanner. Fig. 3(a) A schematic of the ECAT II scanner developed by EG & G ORTEC in Oak Ridge, Tennessee showing the limited solid angle coverage of the early PET scanners; the design was based on the PETT III developed in St. Louis by Ter-Pogossian and coworkers, and (b) the first commercial PET scanner, the ECAT I, shown at UCLA. 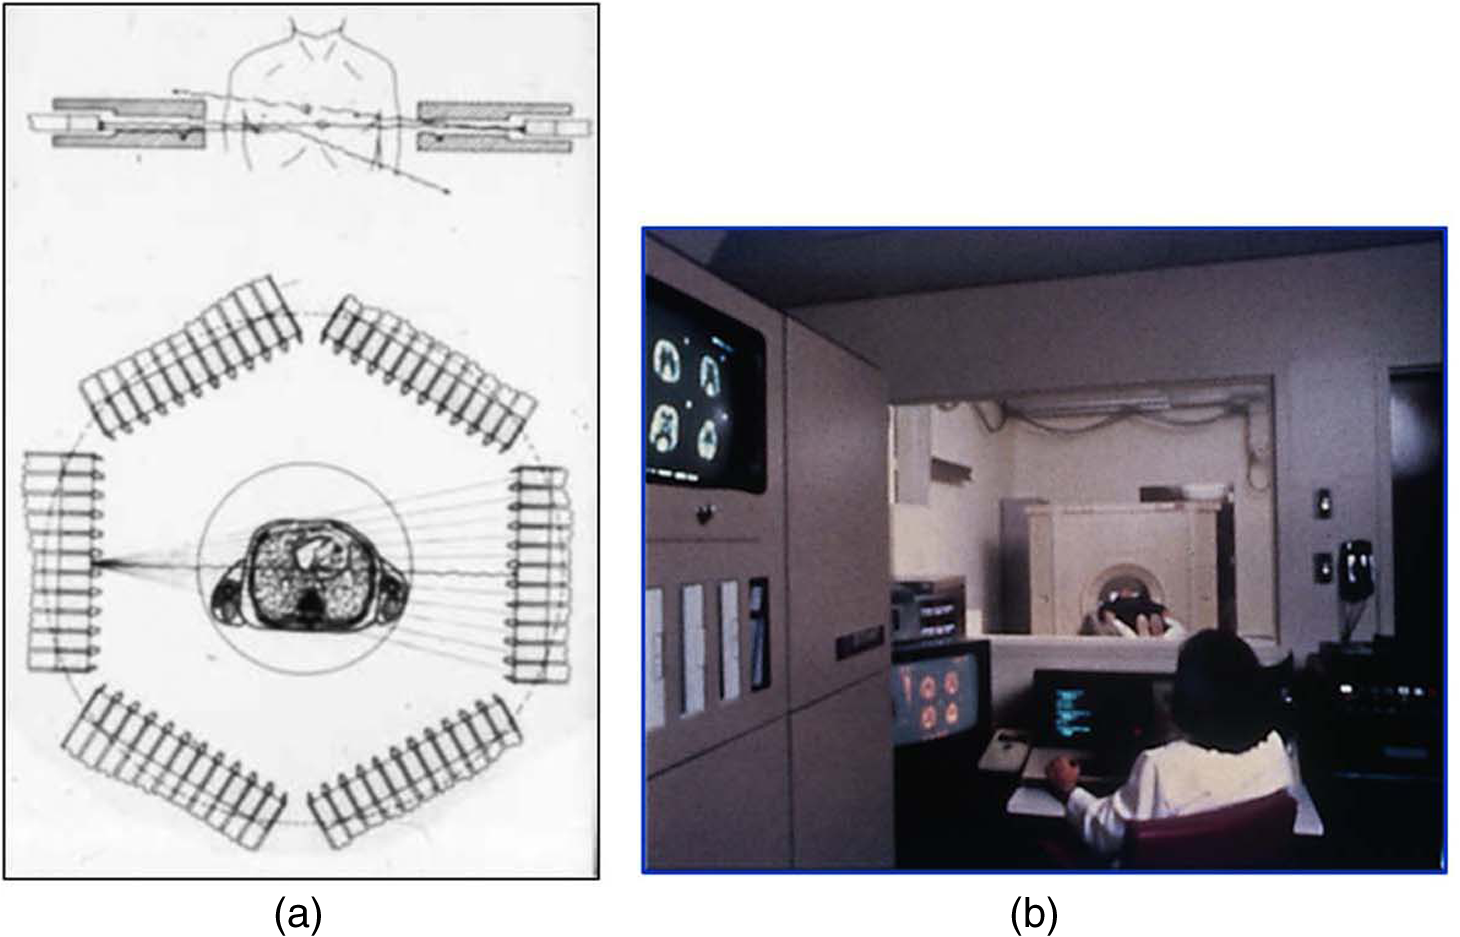 After relocating to UCLA, Hoffman et al.25–30 published a series of papers with coworkers on the criteria needed to obtain true quantification using PET. The next design that was introduced featured a ring-based geometry that, because of size and spacing of the detector elements, required innovation to obtain sufficient spatial sampling. This was achieved by a half-crystal rotation and a wobble of the entire detector ring. The wobble mode required the center of the tomograph to be moved to four specific locations around the circumference of a circle 1 in. in diameter, a design developed by Eriksson31 at the Karolinska Hospital in Stockholm, Sweden. A complete emission data set was acquired at each wobble position, thereby sampling different lines of response throughout the field-of-view. The four sets could then be sorted into parallel projections with higher projection sampling than any one of the individual acquisitions. An alternative approach to increased spatial sampling was the “clam shell” design of Derenzo et al.32 at the Berkeley Laboratory in California. These early designs incorporated one-to-one coupling between the scintillation crystal and photodetector, usually a photomultiplier tube. Such photodetectors complicated the assembly of multiple transaxial planes that would image an extended axial coverage. Nevertheless, the NEUROECAT was completed successfully, a design that comprised three octagonal arrays of bismuth germanate (BGO) detectors yielding five transaxial planes that were imaged simultaneously.33 This was followed by the ECAT III incorporating three rings of detectors designed primarily for cardiac imaging.34 The smaller crystal size incorporated into the ECAT III resulted in sufficient in-plane sampling to obviate the need to rotate or wobble the ring. A further innovation, pioneered by Eriksson at the Karolinska Institute in association with the Scanditronix Company in Uppsala, was the phoswich design aimed at producing higher in-plane resolution. This involved coupling two scintillation crystals, one BGO and one gadolinium orthosilicate (GSO) to a single photomultiplier. The different light output characteristics of BGO and GSO allowed the specific crystal to be identified and this detector configuration was incorporated into a whole-body scanner design.35 4.Instrumentation for Positron Emission Tomography: Block Detector and Current Commercial DesignsIn view of the finite size of photomultiplier tubes, one-to-one coupling proved to be a physically limiting and an expensive means for increasing volume spatial resolution and axial coverage. Since the subject receives a whole-body radiation dose irrespective of whether the part of the body is within the imaging field of view, extending the axial coverage makes better use of the emitted photon flux and improves overall system sensitivity. The limitation of one-to-one coupling in ring systems was overcome by using the well-established method of light sharing between photomultipliers pioneered by Anger in the gamma camera, which had been adopted earlier in the construction of the MGH positron camera.10 Using this light sharing technology, Casey and Nutt36 developed a block detector, composed of four photomultipliers coupled to an array of crystal elements, each 5.6 mm (transaxial) by 12.9 mm (axial) and 30 mm deep. The scintillation crystal used was BGO, which is not only more dense than the previously used sodium iodide, it is not hydroscopic and, hence, could be more easily assembled into a mosaic array. The principle of the block detector is shown in Fig. 4 for an array coupled to four photomultipliers. Fig. 4(a) The block detector concept invented by Casey and Nutt in 1985. The incident annihilation photon is converted to light in the scintillator and the sharing of light (b) between the four photomultiplier tubes identifies the scintillator element and localizes the incident photon. The output from the block detector is the coordinates of the element and the energy () of the photon obtained by summing the light produced in the scintillator. 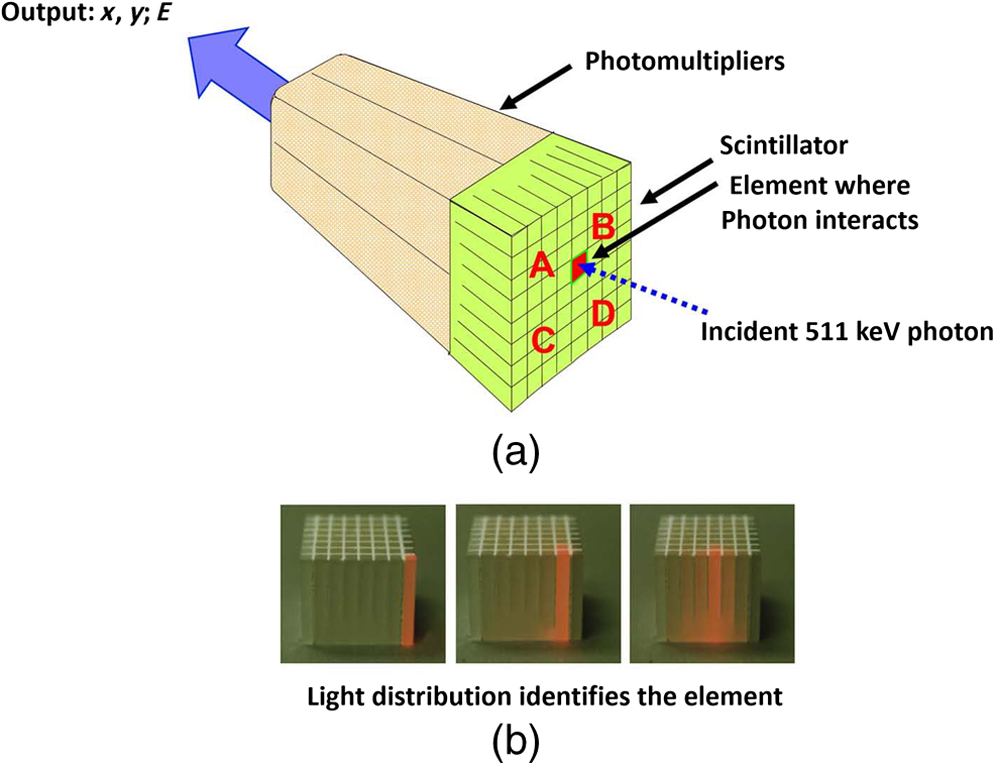 The first commercial block-based PET scanner, which had a 10-cm axial length and 15 transaxial-plane read-out, was acquired by the Hammersmith group37 in London. It was fitted with eight retractable rings of for transmission scanning that were also conveniently used for daily detector checks. The initial designs with multiple rings of detectors incorporated thin sheets of tungsten, termed septa, between the detector rings. Septa restricted the detection of photons to within a given detector plane and one adjacent plane either side, such that a 3-D volume of activity was essentially imaged as a set of 2-D parallel transaxial planes. While septa reduced system dead time and limited the detection of random and scattered coincidences from other regions of activity, the small acceptance angle for true coincidences resulted in very low overall sensitivity. Thus, 2-D acquisitions proved a challenge to the collection of statistically high-quality time course data within the short-time frames required for kinetic sampling. The temporary removal of the septa from the first block detector scanner at the Hammersmith demonstrated both the sensitivity improvement when recording all possible coincidences between all opposing detector elements and the ability to perform fully three-dimensional (3-D) reconstructions.38 This led to the design of a generation of PET scanners, which had the option of recording data in both the septa-in (2-D mode) and with septa retracted (high sensitivity “3-D” mode), as shown in Fig. 5. Fig. 5A schematic of 2-D and 3-D PET acquisition geometry. The original multiring PET scanner configuration (a) incorporated lead or tungsten shields between the detector rings thereby limiting acquisition to positron events within each ring; out-of-plane photons were eliminated by the septa. With the septa removed (b) a full 3-D acquisition is possible including both in-plane and out-of-plane photons.  The first such scanner with retractable septa was installed at the Hammersmith Cyclotron Unit in 1991 as a brain-only machine.39 Attenuation measurements were performed using three retractable rod sources rotated around the patient when the septa were extended. A technique was developed to correct for the increased scatter fraction in 3-D by recording an additional coincidence window over the Compton region of the energy spectrum.40 Taking advantage of the increased sensitivity of 3-D data collection with no septa, a lower-cost scanner was developed composed of 40% of the ring of detectors that were then rotated around the patient to collect all tomographic views.41 A schematic and photo of the device is shown in Fig. 6. This low-cost design was commercialized in the early 1990s as the ECAT ART. However, once Medicare reimbursement for certain PET studies became a reality in 1998, interest in low-cost scanners declined because there was a strong business case to equip clinical PET centers with the more expensive full-ring scanners that offered faster imaging times and hence higher throughput. Even so, advantage was taken of the rotating gantry PET technology in combining it with a spiral x-ray CT scanner to produce the first prototype of a combined PET/CT device that will be described later. Fig. 6(a) A schematic of the PRT-1, a rotating PET scanner developed at the University of Geneva, Switzerland, and CTI PET Systems, Knoxville, Tennessee; the lower-cost design comprises 40% of the detectors used in a full ring scanner and has no septa, and (b) the PRT-1 showing the two banks of opposing BGO block detectors that rotated around the patient to acquire a full, 3-D data set. 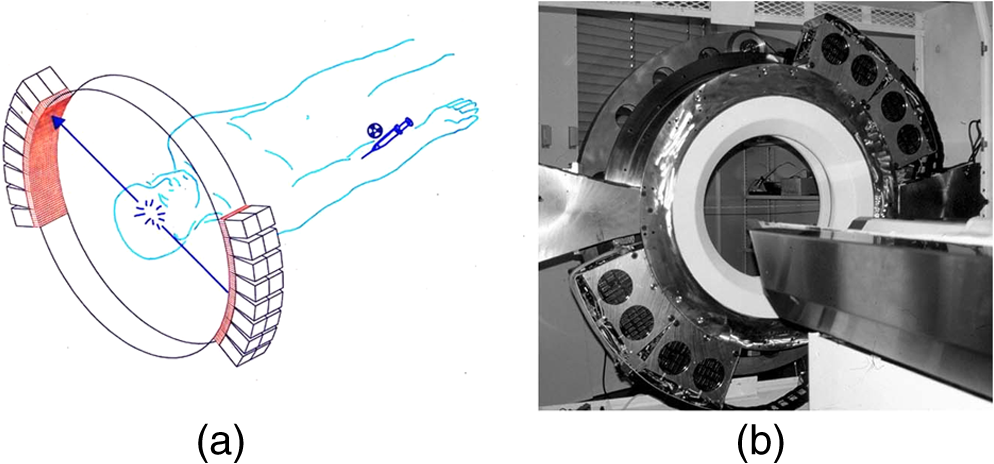 Throughout the 1980s and most of the 1990s, BGO was the main scintillator used in PET scanners manufactured by CTI PET Systems (CPS, a joint venture with Siemens Healthcare) and General Electric. The block design pioneered by Casey and Nutt36 was refined into different matrices of crystals coupled to four phototubes. In particular, the ECAT HR 47 comprised a matrix of crystals of size and became a workhorse of clinical PET, and the ECAT HR+ comprised crystals of for high-resolution brain and whole-body imaging. An extended design was evaluated at Hammersmith Hospital Cyclotron Unit in the late 1990s—the ECAT EXACT3D,42 shown in Fig. 7, comprising six rings of HR+ detector blocks instead of the four rings in the standard HR+. Having no retractable septa and hence operating fully in 3-D, the design had a 25-cm axial field-of-view and achieved a sensitivity of 10% for a centrally located point source. Attenuation correction is performed by a rotating a source of activity. Fig. 7The high-sensitivity ECAT EXACT3D at Hammersmith Hospital, London, in 1999. At the time, this was the most sensitive PET scanner ever designed and built and it operated entirely in 3-D mode without septa.  Today, essentially all commercial PET scanners collect data in high-sensitivity, 3-D mode as they are, in any case, not equipped with septa. Since the scatter fraction in 3-D may attain 35% or even higher as a fraction of the acquired data, sophisticated scatter correction models have been developed to address this problem. An early 2-D scatter correction technique was developed by Bergstrom et al.43 based on integral transformation of the projection data. The advent of 3-D PET demanded a different approach, and one of the first was the convolution–subtraction method of Bailey and Meikle.44 This approach was later replaced with the single scatter model developed initially by Ollinger45 and independently by Watson et al.46 that uses both the (uncorrected) emission activity distribution and the map of the attenuating medium to estimate the scatter distribution. The widespread adoption of 3-D acquisitions challenged the limits of BGO, especially for whole-body imaging of large patients. The response was an ongoing search for a scintillator with better light output, faster rise and decay times, improved energy resolution, and reduced dead-time. To achieve improvements in spatial resolution, the detector blocks would need to be subdivided into a finer array of elements, therefore, requiring increased light output in order to correctly identify the detector element without significant mispositioning. The higher light output would also improve energy resolution leading to a more efficient rejection of scattered events. The search led to the discovery of a new scintillator, lutetium oxyorthosilicate (LSO), that had originally been used for nuclear well logging but was found to have much superior light emission properties to BGO for PET imaging.47 The first commercial PET scanner incorporating LSO was the ECAT ACCEL48 that appeared around 1999. LSO is also the scintillator used in the high-resolution research tomograph (HRRT) for brain imaging.49 While some vendors have used a derivative of LSO that incorporates a small percentage of yttrium (LYSO), Philips Healthcare introduced a PET scanner (Allegro) with GSO as the scintillator.50 The technical advantages of these new scintillators resulted in better energy resolution leading to finer subdivisions () in the detector blocks and lower scatter fractions and improved timing resolution leading to lower random coincidence rates. Overall, the new scintillators yielded considerably higher noise equivalent count rates, especially for whole-body imaging of large patients. A major advantage of LSO, apart from the higher light output leading to better spatial and energy resolution, is the fast timing that leads to lower detector dead time and, above all, the capability to measure the time difference between the arrivals of the two annihilation photons in the detectors. This ability, termed time-of-flight (TOF), provides positioning information for the annihilation point that is not available without TOF. Although with current levels of timing the annihilation point can only be localized to within a few centimeters, it is better than no information at all. The timing information, by restricting the annihilation point to within a few centimeters, translates into a statistical gain and, thus, lower noise in the image. TOF for PET had been explored in the 1980s with scintillators that were fast but had low stopping power; BGO is too slow a crystal for conventional TOF imaging. However, it was not until LSO appeared that TOF made a resurgence with the launch of the Philips Gemini TF (TrueFlight),51 followed by the Siemens Biograph mCT. A study performed on the Siemens Biograph 6 Truepoint demonstrated improved lesion detectability from reduced image noise,52 especially for large patients with . Nowadays, all PET scanners using fast scintillators integrate TOF into the reconstruction algorithm with a timing resolution of around 500 ps for photomultiplier-based detectors and below 400 ps for detectors incorporating the new solid-state photodetectors to be discussed later. Improvements in the presentation of image data have contributed significantly to the increased adoption of PET. In the brain, coregistration of PET and MRI scans has helped in the interpretation of the anatomical functionality of this complex organ. In oncology, the PET data were originally presented as a series of transaxial planes. However, since the typical axial coverage of a PET scanner is 16 to 25 cm, in order to image the whole-body with , patients had to be moved axially through the field of view of the scanner. The feasibility of this multistep imaging protocol was originally demonstrated by Dahlbom et al. at UCLA. They also showed that it was possible to display such large volumes of image data as integrated longitudinal sections.53 Subsequently, this has proven to be especially important in the case of cancer staging when searching for metastatic deposits anywhere in the body. A typical scan of a patient with metastatic disease is shown in Fig. 8, acquired by stepping the patient through the scanner in discrete positions. Fig. 8A whole-body image of the patient injected with FDG is acquired by moving the bed through the scanner in discrete overlapping steps (a), typically covering the range from base of brain to thighs in 5 to 7 bed positions depending on the height of the patient. The acquired image (b) then shows the use of glucose in all organs throughout the body. A tumor would appear as a region of abnormal uptake, as shown for this patient at the apex of the lung (arrowed).  While the major vendors of PET scanners adopted BGO as the scintillator of choice from the late 1970s until LSO became available in the late 1990s, there was one exception. Muehllehner, Karp et al.54 at the University of Pennsylvania developed a device based on the original sodium iodide (NaI) scintillator used in nuclear medicine gamma cameras. Known originally as the HEAD PENN-PET, the group used various technical and data processing techniques to extract the maximum performance from a NaI PET scanner. A company, UGM Medical, was launched to commercialize the design that eventually became known as the C-PET. The success of UGM with NaI suggested to vendors of gamma cameras that a dual-headed gamma camera equipped with coincidence circuitry could function as a PET scanner55 thereby capitalizing on the large installed base of gamma cameras. However, image quality was significantly poorer compared to a dedicated PET scanner and therefore, given the expectation that small lesions could be missed resulting in a misdiagnosis, this approach was soon abandoned in favor of dedicated PET instrumentation. Finally, some PET scanners have been designed to image specific organs such as the brain, breast, or prostate. One example is the pioneering work undertaken by the Montreal group for a device that images breast tumors.56 Physically, this is a very challenging site given the high levels of interference from radioactivity within the chest. Since that early work, a number of designs for breast PET have emerged, including a couple of commercial systems such as the Oncovision MAMMI design.57 Despite the improvements in spatial resolution, sensitivity, and specificity offered by these dedicated devices, in practice most centers prefer a whole-body PET scanner that can image all organs. 5.Preclinical Positron Emission Tomography for Small AnimalsDuring the early 1990s, it was recognized that PET could also play a role in imaging small animals such as rodents to obtain longitudinal data in time to avoid sacrificing an animal at each time point, which is an inefficient, expensive, and inaccurate process. Thus, the group at Hammersmith explored the RAT PET58 design using detectors from a human PET scanner. Since the detectors were optimized for human imaging, the spatial resolution of RAT PET was limiting for rodents. Cherry et al.59 at the Crump Institute in Los Angeles developed a detector specifically for rodents and assembled the microPET, the first successful small animal PET scanner. The design was commercialized by Concorde Microsystems (later acquired by CTI Inc., Knoxville, Tennessee) in Knoxville, Tennessee. A number of systems were sold for preclinical studies from 1995 onward and a combination with magnetic resonance imaging was explored, by Shao et al.60 Following the availability of LSO in the late 1990s, LSO-based microPET scanners with a spatial resolution below 1 mm became available. A preclinical system with high spatial resolution was developed by Lecomte et al.61 at Sherbrooke University in Canada using avalanche photodiodes (APDs) as the photodetector. This was a significant development as it was one of the first designs to use magnetic-field insensitive PET detectors, contemporaneous with the work of Shao et al.60 and a decade before APD-based detectors were used in the first clinical PET insert. Since 2005, when Siemens Healthcare acquired CTI Inc., the microPET has been marketed as the Siemens Inveon PET/CT scanner,62 although the company recently withdrew from the market for preclinical PET/CT instrumentation. Other vendors have also offered preclinical PET systems including General Electric, Philips, Bioscan, and Mediso in Hungary. The business model is somewhat tenuous owing to the small size of the overall market although PET imaging of rodents has made some significant contributions to science, such as the ground breaking use of PET to image gene transfer and expression in animal tumors.63 They also serve to support the preclinical development of new PET imaging biomarkers and paradigms and have a role in drug discovery. In addition, microPET scanners have been used to provide proof of concept of therapeutic efficacies of agents where the nondestructive nature of in vivo molecular imaging provides a unique means for following changes over time in the same animal. As in the clinical scanners, the microPET components are combined with x-ray CT and, more recently, with an MR scanner.64 An area which is somewhat underdeveloped is the preclinical imaging of larger animals, such as nonhuman primates (NHP), dogs, and pigs. An NHP scanner has recently been constructed at the University of California, Davis (S. R. Cherry, private communication). However, in general, while such animals require clinical-sized systems rather than the microPET, they offer platforms to explore new PET ligands for neuro studies (NHP), cardiovascular disease (pigs), and naturally occurring malignancies (dogs). 6.Tomographic Reconstruction AlgorithmsIn parallel with the technical development of PET instrumentation, improvements have been made in the reconstruction algorithms used to produce tomographic images. The early single ring systems, and the multiring scanners with septa acquired data in 2-D that were then reconstructed using an approach based on the direct inversion of the 2-D Radon transform, termed filtered backprojection (FBP).65 First attempts at 3-D reconstruction rebinned the 3-D data into a set of parallel 2-D transaxial planes using a technique termed single-slice rebinning (SSRB).66 The set of 2-D planes were then reconstructed with the standard FBP. The inaccuracies in the SSRB algorithm resulted in blurring of the image along the axial direction. This blurring was eliminated in the 3-D reprojection (3DRP) algorithm proposed by Kinahan and Rogers,67 an algorithm that is essentially the 3-D extension of 2-D FBP with a technique to complete the partially measured projections. Defrise et al.68 pioneered the Fourier rebinning algorithm (FORE) that accurately rebinned 3-D data sets into 2-D, eliminating the inaccuracies of SSRB. Thus, once again a 3-D data set could be reconstructed with an efficient, 2-D reconstruction algorithm, opening up the possibility of using statistically based, iterative algorithms. Such algorithms offer improved noise characteristics compared to direct inversion algorithms such as FBP, but they are generally more computationally burdensome than direct methods and were, at that time, prohibitive in 3-D. An iterative approach, the maximum-likelihood expectation maximization (ML-EM) algorithm had been introduced by Dempster et al.69 and subsequently applied to PET by Shepp and Vardi70 and Lange and Carson.71 Hudson and Larkin72 published ordered subset EM (OSEM), an accelerated version of the ML-EM approach that made iterative reconstruction a practical alternative to direct inversion. A further improvement, suggested by Hudson and Larkin, was the incorporation of the attenuation weights into OS-EM (AWOSEM) and the combination of FORE and AWOSEM offered improved image quality compared with 3DRP.73 The incorporation of corrections for randoms, scatter, attenuation, and detector efficiency variations into the system model preserved the underlying Poisson statistics of the data and resulted in the ordinary Poisson (OP)-OSEM algorithm, first investigated in 2-D.74 Finally, eliminating the rebinning step (FORE) and implementing OP-OSEM fully in 3-D led to the widely used 3D-OP-OSEM.75,76 A complete discussion of PET reconstruction algorithms is beyond the scope of this review; a comprehensive treatise on the topic has been published by Defrise et al.,77 and a monograph devoted to 3-D PET has been edited by Townsend and Bendriem.78 When a time series of 3-D images are acquired instead of one static image, a 4-D reconstruction can be performed incorporating the 3-D kinetic data, thereby capitalizing on the statistical information contained within the whole of the recorded time series data79,80 rather than just each specific 3-D frame. The kernel matrix reconstruction captures the similarity between pixels and provides a means to regularize image reconstruction (i.e., reducing noise) without imposing an additional penalty function. In particular, it provides better image quality for low-count data.81 A major restriction to realizing both high-sensitivity and good spatial resolution in PET scanners has been the fact that when a photon enters a matrix of detector elements, it may enter through one element, deposit its energy at an unknown location in depth within that element or may exit to deposit energy in an adjacent element. These effects become increasingly problematic as the ring diameter of the scanner is decreased or the axial length is extended, although both procedures increase sensitivity. This problem, which is one of parallax, has been addressed by developing the means to provide a depth of interaction (DOI) measurement in the given detector that registers the event. An example of a commercial scanner (although no longer manufactured) with the capability to correct for DOI effects is the dedicated HRRT brain camera.49 A more pragmatic (and less costly) approach is to actually measure the spatially dependent point spread functions (PSF) that characterize this parallax effect, measuring them for each possible pair of coincident detectors. The variation in the PSF throughout the imaging field-of-view can then be modeled and used to correct for the parallax effect during the iterative reconstruction process. It is important that the model accurately reflects the resolution variation throughout the field-of-view. An artifact that enhances edges artificially may be a consequence of a mismatch of the model and a thorough review of the theory and practice of PSF modeling, and some of the benefits, may be found in Rahmim et al.82 As an illustration, the improvement in image quality with PSF modeling for an scan is shown in Fig. 9. The process is often referred to as high-definition (HD) PET such that all possible coincident lines-of-response are recorded in a scanner without loss of spatial resolution. This results in improved image quality due to maximizing the detection efficiency with better positioning of the lines-of-response, and consequently less statistical uncertainty (noise) in the image; high spatial resolution is maintained throughout the field-of-view.83 This development is especially important for the brain where a critical structure for imaging, the cerebral cortex, is located toward the periphery of the field-of-view. Panin et al.84 have shown that a point source resolution measurement that degrades from 2.5 mm in the center of a scanner to 6.2 mm at 20 cm from the center improves, when PSF modeling is applied, to around 2.0 mm uniformly throughout the field-of-view. Fig. 9The improvement in image quality from modeling the system PSF for (a) the brain and (b) a whole-body scan; the image on the left is without modeling and the image on the right is with PSF modeling. Note the sharper detail and improved lesion detectability for the small lesion in the whole-body scan (arrowed).  The introduction of the fast scintillator LSO led to the incorporation of TOF information into the reconstruction algorithms. Each line-of-response is subdivided into a number of different time bins, typically 13 depending on the timing resolution. A coincident event is assigned to a particular time bin depending on the measured time difference between the pair of annihilation photons. The acquired data are sorted into different arrays (sinograms) for each time bin, reconstructed and combined into a final image incorporating TOF information. This spatial information on the annihilation point for each event results in improved signal-to-noise throughout the imaging volume. This improvement in image signal-to-noise as a consequence of incorporating TOF into the image reconstruction is shown in Fig. 10. Although, as mentioned, BGO has always been considered too slow a scintillator to implement TOF acquisition, a new approach is being considered85 by using the Cerenkov light emitted by a charged particle travelling faster than the speed of light in the medium (crystal). The Cerenkov emission from BGO could be fast enough to allow TOF even though the standard light emission from the scintillator is not adequate, a point of interest because BGO is a considerably less costly material and with a higher photon stopping power than LSO. 7.From Positron Emission Tomography to PET/CT and BeyondDuring the 1990s, and even as far back as the 1960s, there was interest in combining (fusing) different imaging modalities to obtain a more complete picture of disease. However, since the imaging devices were separate and often located in different clinical departments, combining different modalities was achieved through increasingly sophisticated software fusion algorithms. Such algorithms achieved a high level of accuracy in fusing images of the brain, PET with MR or PET with CT, since the brain is fixed within the skull and has only a limited number of degrees of freedom. In the rest of the body, the problem is much more complex owing to the greater number of movement possibilities for other organs and structures compared to the brain. This problem had been recognized by a pioneer in multimodality imaging, the late Bruce Hasegawa from UCSF, who first adopted the approach of “hardware” fusion by physically combining two imaging modalities: SPECT and CT in 1991.86 Independently, also in 1991, Townsend and Nutt proposed combining PET with x-ray CT although they were unaware that, some 7 years earlier in 1984, Prof. Nagai et al. at Gunma University in Japan had developed a PET/CT design (Prof. Y. Sasaki, private communication). The design comprised a PET and a CT scanner side-by-side with a single bed mounted on a platform that moved sideways, parallel to the scanner gantries. The platform thus transported the bed from one scanner to the other and allowed coregistered PET and CT images to be acquired without the patient leaving the bed. In contrast, the design proposed by Townsend and Nutt combined the PET and x-ray CT modalities into a single device that would image both anatomy (CT) and function (PET). The underlying concept was to provide an accurate high-resolution anatomical framework from CT for the lower resolution functional images from PET. Since the patient could be translated through the combined device, even though the CT and PET were acquired sequentially, a complete whole-body PET/CT scan with minimal patient movement could be obtained in a single session. In a collaboration between CPS Innovations (Knoxville, Tennessee) and the University of Pittsburgh, a prototype PET/CT scanner was developed87 with funding from the National Cancer Institute and began clinical evaluation at the University of Pittsburgh Medical Center in 1998, in the same year that Medicare approved reimbursement for some PET studies. Although the Pittsburgh prototype, shown in Fig. 11, was designed to perform clinical CT and clinical PET imaging in a single device, an additional advantage was that the CT could be used to provide the attenuation correction factors required for the PET data.88 A review of the development of multimodality imaging can be found elsewhere.89 Clinical interest in the PET/CT prototype was initially mixed with some enthusiastic proponents and substantial conservative opposition. However, the results from early PET/CT patient scans were sufficiently impacting to motivate both General Electric (Discovery PET/CT) and Siemens (Biograph PET/CT) to develop a commercial design that appeared within a few months of each other in 2001. The improved PET imaging capability and the use of the CT provide the attenuation correction factors for PET in a few seconds instead of the many minutes required in PET-only scanners, resulted in greatly increased patient throughput compared with PET-only scanners. Since PET scans for an increasing range of oncology indications were being reimbursed, the reduced time for a PET procedure, resulting in higher patient throughput, was of great economic benefit to a hospital and gave increased patient access to PET imaging. The fused images from PET/CT, by synergising the metabolic data from PET with the CT anatomy, greatly assisted image interpretation and, as a result, offered more accurate staging and better diagnosis. Within 3 years, by 2004, PET only scanners were no longer obtainable from the major vendors. Philips also joined the range of companies offering a PET/CT scanner (Ingenuity) and the adoption of the technology was rapid. The major vendors have continued to develop the PET/CT technology throughout the past decade with the integration of increased multislice CT and improvements in the software for acquisition, reconstruction, and display. Recently, Toshiba America Medical Systems (now Canon) re-entered the US market with their Celesteion PET/CT system and a newcomer, United Imaging Healthcare-based in Shanghai, introduced the uMI 510, a high-resolution PET/CT scanner with 110,592 LYSO crystals. Thus, even after more than 16 years of commercial PET/CT, new designs are still being introduced, particularly with the appearance of a new photodetector that will be described in more detail later. Fig. 11The first PET/CT scanner design (a) combining a spiral CT scanner with a rotating ART PET scanner mounted on the same support as the CT. The CT images are acquired first by moving the bed continuously through the scanner, whereas the PET images are acquired by discrete steps of the bed as shown in Fig. 7. The fused images (b) of CT and PET are displayed on the screen for reading by the attending radiologist.  The benefits of PET/CT over PET and CT acquired separately are now documented in more than 12,000 publications and there are more than 5000 PET/CT scanners in operation worldwide. A pelvic PET/CT scan of a prostate cancer patient injected with -fluorocholine is shown in Fig. 12. The widespread availability of PET/CT scanners has led to a number of other advances that have improved image quality. These include respiratory and cardiac gating, particularly when imaging the thorax.90 Respiration can be monitored externally by either a pressure belt around the chest or by following the movement of markers placed on the chest. The motion information can be integrated into the reconstruction process by repositioning lines-of-response within a fixed reference frame. A continuous acquisition can be divided into gates based on a respiration or cardiac signal and each gate reconstructed separately. The PET/CT offers the possibility of using a 4-D CT scan to correct for movement, although at the cost of increased radiation dose to the patient.91 A recent strategy to reduce radiation dose from the CT has been the introduction of iterative reconstruction comparable to that routinely used in PET. Since its inception in 1972, CT has always benefitted from a high photon flux that allowed direct reconstruction methods to be used instead of the statistically based algorithms more suitable for photon-starved modalities such as PET. Thus, reducing the x-ray flux (and hence the radiation dose) and using an iterative reconstruction technique, a comparable image quality can be achieved with a lower radiation dose to the patient.92 Finally, a recent innovation introduced on the Siemens mCT is that of continuous bed motion acquisition instead of the conventional step-and-shoot approach to whole-body imaging [Fig. 8(a)]. Termed the mCT flow, the approach acquires the whole-body as a single 3-D volume rather than a number of individual bed positions that have then to be compiled into a single volume.93 While the mCT flow motion approach provides a very convenient and flexible interface for whole-body imaging, eliminating the requirement to cover the whole-body in a discrete number of overlapping bed positions, the superiority of continuous bed motion has yet to be clearly demonstrated. Fig. 12An -fluorocholine PET/CT scan over the pelvic bed of a patient with prostate cancer demonstrating a choline-avid lesion in the left prostatic lobe (arrowed); (a) CT scan, (b) PET scan, (c) PET/CT fused image. Following a radical prostatectomy and histopathological analysis, this tumor was assigned a Gleason score of . Images courtesy of Dr. Joshua Schaefferkoetter, Clinical Imaging Research Centre, Singapore.  Even before PET/CT became clinical reality, around the mid-1990s, there was considerable interest within the preclinical domain for the combination of PET with MR. This was largely due to the better soft tissue contrast obtainable with MR compared to CT, particularly useful when imaging small animals.64 However, the photomuliplier-based photodetectors used since the beginning of positron tomography, do not function in a magnetic field and require shielding even from the Earth’s field. Consequently, PET detectors could not be operated inside, or even close to, an MR scanner, precluding the possibility of a PET/CT-like approach without additional shielding or a different detector configuration. Throughout the 1990s and after the turn of the century, much effort was devoted to the development of semiconductor photodetectors that would be stable, efficient, low noise, fast, and operate at reasonable temperatures. The first such device that satisfied some of these specifications to be used in a PET detector was an APD; a prototype preclinical imaging device incorporating APDs appeared around 2005. A year later, in 2006, Siemens Healthcare Molecular Imaging produced the first PET detector ring using APDs that could be inserted into a 3T clinical MR to acquire PET data simultaneously with the operation of the MR. The ring diameter limited studies to the brain94 and the company produced only five such inserts. Then, in 2010, Siemens installed the first APD-based whole-body PET/MR with simultaneous imaging capability, the Biograph mMR shown in Fig. 13, at the Technical University in Munich.95 The design generated significant interest, especially as a research instrument, and during the following 4 years 80 such systems installed worldwide. Fig. 13The combined PET/MR scanner (Siemens Healthineers) with simultaneous MR and PET imaging capability.  Despite the recognized advantages of better soft tissue contrast, no radiation dose from the CT scan, motion correction possibilities from the MR, and obvious benefits for pediatric patients and imaging of brain, liver, heart, and joints, the PET/MR has remained attractive mainly for research studies rather than routine clinical use. Also in 2010, Philips unveiled their PET/MR design (Ingenuity TF)96 that kept the MR and PET separate 3 m apart) with a bed that swiveled the patient from the MR to the PET; extra shielding of the PET scanner was required to operate within 3 m of a 3T MR scanner and, thus, the design does not allow simultaneous imaging of PET and MR. As mentioned, one advantage of the simultaneous design is that the MR navigator sequence can be used to monitor movement and subsequently correct the PET data, without any increase in radiation dose that is implicit in a 4-D CT acquisition on the PET/CT. This is an important advantage of PET/MR although using the MR for motion correction does not, in itself, justify the high capital cost of the combined device. Figure 14 shows a whole-body PET/MR scan of a patient with myeloma where multiple vertebral lesions can be seen showing increased FDG uptake. The PET image is fused with a T1-weighted MR scan. Fig. 14A whole-body FDG-PET/MR scan of a patient with myeloma where the FDG-PET is fused with T1-weighted MR images. Multiple vertebral lesions are seen in the coronal slice with increased uptake of FDG. The images are (a) T1-weighted MR, (b) PET, and (c) fused PET/MR. Images courtesy of Dr. Joshua Schaefferkoetter, Clinical Imaging Research Centre, Singapore.  Since the announcement of the mMR in 2010, a new photodetector, the silicon photomultiplier97 (SiPM) has emerged offering much faster timing than the older APD and the possibility of one-to-one coupling between the scintillator elements and the photodetector. In 2013, Philips announced a PET/CT scanner (the Vereos) that employs a digital SiPM (dSiPM) as the photodetector and thus, even though the SiPM development was driven originally by the need for an MR-compatible photodetector, the emergence of SiPMs may result in compact, lower cost, and higher performance detectors for PET/CT. Also adopting the SiPM development, in 2013, GE launched an SiPM-based PET/MR with simultaneous imaging capability, the SIGNA PET/MR. In 2016, GE further announced a PET/CT, the Discovery MI that incorporates PET detectors with SiPMs. As of February 2017, there are more than 120 PET/MR installations worldwide, the majority active in research environments since the transition to the clinic is limited by the cost of the technology and the absence, thus far, of a sufficiently proven unique application. Since 2011, much has been made of the comparison between PET/CT and PET/MR performance, especially for oncology applications, and a recent metaanalysis98 involving more than 2300 cancer patients demonstrated no clear benefit for PET/MR over PET/CT as long as the MR is used only to provide an anatomical framework. Such a protocol seriously underexploits the power of MR and as potential clinical applications emerge from the early adopters and, hopefully, the technology becomes more affordable, PET/MR will undoubtedly find a place alongside PET/CT in the clinic, just as MR and CT have coexisted since the early 1980s. For a review of the current status of PET/MR, see Ref. 99. As an illustration of the extraordinary increase in the performance and complexity of PET scanners from the 1970s to the present day, consider the ECAT II, which, in 1976, consisted of 66 detectors, 363 lines-of-response and achieved a point source sensitivity estimated at 0.16%. Compare this performance to that of the state-of-the-art, four-ring Siemens Biograph mCT PET/CT scanner that comprises 32,448 detector elements, 11,136 lines-of-response and has a measured point source sensitivity of 6.4%. Thus, the improvement in sensitivity has been a factor of 40 over the 40 years since the ECAT II was operational at UCLA, a significant achievement. It is worth noting that, because of the higher stopping power of BGO compared to LSO, the ECAT EXACT3D40 had a point-source sensitivity of 10%, exceeding even that of the state-of-the-art PET/CT scanners of today. 8.Clinical ApplicationsThe PET technology and advances described above have driven applications in clinical research and healthcare. The initial stimulus for PET was for human brain studies, given the anatomical and biological complexity of this organ. Furthermore, direct and indirect costs associated with human brain disorders are dominant in healthcare which, in Europe alone, amount to some 800 Billion Euros per year.100 Initial studies focused on the available PET tracers that included those imaging regional cerebral blood flow using -labeled water, oxygen utilization101 using molecular , and glucose utilization20 using . The increasing drive to improve spatial resolution and axial coverage of the brain was largely in response to the progressive introduction of a wide range of specific neurotransmitter and neuroreceptor imaging biomarkers labeled with and . The sensitivity and temporal resolution of PET scanners made it possible to acquire scans kinetically that could then be modeled to quantify rate constants of neurotransmitter pathways and binding.102 Improved spatial resolution and increased axial coverage, as offered by the block detector technology, had an immediate impact for regional brain activation studies using -labeled water.103 For such studies, it is important to be able to survey the topography of activation across most of the brain. This stimulated the development of statistical parametric mapping (SPM), which has proved to be one of the most influential analytical methods for identifying regional changes in images of brain function.104 The enhanced sensitivity brought about by the introduction of (septa-retracted) 3-D PET, provided sufficient statistical quality to effect single subject studies.105 This was a significant advance since data from the (septa-extended) 2-D brain activation studies had intrinsically lower statistical quality. Thus, in order to power studies, groups of subjects had to be combined thereby considerably limiting the ability to undertake activation studies of brain disorders in patients who inevitably present with diverse pathologies. For such an anatomically complex organ as the human brain, the coregistration of PET images with MRI proved invaluable,106 a procedure implemented in software with SPM but coregistered images can now be obtained directly since the introduction of combined PET/MR systems.99 The ground-breaking human neuroscience produced by PET-based brain activation studies of cerebral blood flow stimulated the development of the BOLD fMRI brain activation method.107 As a result, this technique went on to dominate the methodology for brain activation studies and the ensuing considerable human neuroscientific outcomes. Currently, new applications of PET in the brain include Alzheimer’s disease with a focus on using the range of biomarkers that have been developed for amyloid and tau imaging.108 Another exciting recent development has been that of a PET biomarker for imaging the synapse, which raises the possibility to combine imaging of the brain and the periphery.109 Since whole-body scanners now cover up to 25 cm axially, the entire human brain can be imaged in a single bed position, obviating the need for a brain-only scanner. One exception is the portable PET scanner developed recently to image mobile patients as they perform regular tasks (S. Majewski, private communication). The HRRT PET scanner is the current state-of-the-art brain imager that was introduced in the late 1990s and, as mentioned, is no longer commercially available.46 For a review on the development, past achievements, and future directions of brain PET, see Ref. 110. The applications of PET in cardiology occurred early in the development of PET applications and employed surrogate tracers for myocardial blood flow, such as -labeled ammonia111 and generator-produced .112,113 The latter, with a 75-s half-life enabled at-rest and challenge studies to measure regional coronary flow reserve. -labeled water has been used as a pure perfusion tracer both for measures of flow reserve and viable tissue fraction.114,115 The measurement of regional myocardial metabolism has been possible using 116 and labeled fatty acids, such as -palmatate117 and -acetate.118 More advanced studies have included the use of -labeled imaging biomarkers of the sympathetic nervous system in the myocardium.119 Historically, the only PET scanners developed specifically for cardiology appeared around the mid-1980s, the POSICAM scanner from Positron Corporation120 in 1985 that used barium fluoride crystals and the ECAT III,32 which had a similar, three detector rings with five image planes arrangement as in the earlier NEUROECAT.31 The subsequent block design, whole-body scanners met the needs of cardiology. Prior to the introduction of the LSO scintillator, 3-D PET scanning of the heart using BGO scintillators was challenging due to the high out-of-field photon flux that resulted in high dead time and random coincidence rates.121 This meant that only relatively low levels of PET tracer could be injected, although this limitation was to some extent mitigated when LSO-based systems were introduced. For a thorough review of PET in cardiology, see Ref. 122. The application of PET in oncology developed more gradually than neuro and cardiac PET. had been developed primarily for imaging brain metabolism and earlier work in PET oncology developed as extensions of the brain disorders programs by focusing on the detection of brain tumors. For this, it was considered that imaging amino acid transport would be a big differentiator between the nonproliferating normal brain tissue and malignant tissue. This was shown to be the case using, for example, -labeled methionine.123,124 However, Di Chiro, a neuroradiologist at the National Institutes of Health, showed that the more readily available was useful for detecting recurrent tumor despite the high background of glucose utilization from normal brain tissue.125,126 Evidence of the preference of a malignant tumor for anaerobic glycolysis, known as the Warburg effect,127 was demonstrated when comparing oxygen utilization of brain gliomas, using , to that of glucose utilization using .128 The confirmation of the high glucose utilization of lung cancer, and its detectability against the low-density normal lung tissue,129 opened up the possibility for the subsequent extensive use of in cancer. As a consequence, it has become the principle clinical PET procedure for detecting, staging, and assessment of treatment response of cancer.130 The oncology application of PET has been a major driver for the developments in PET scanner technology, and, in particular, whole-body imaging, PET/CT and to a lesser extent, PET/MR. Over the years, other generic PET imaging biomarkers of cancer have been developed, such as for tumor perfusion, proliferation, apoptosis, hypoxia, and angiogenesis. Additionally, by radiolabeling new anticancer drugs, it has been possible to use PET in early stages of clinical trials to obtain unique information of drug pharmacokinetics in normal and malignant tissues. For a review on the historical development of PET in oncology, see Ref. 131. More recently, significant developments have resulted from the introduction of biomarkers of specific cancers. Examples of this approach are the use of specific antibodies, which, because of their long biological half-life in the blood, must be labeled with longer-lived PET radionuclides such as (half-life: 78.4 h). This is because the incorporation of the antibody into the tumor tissue and its clearance from normal tissues is slow and imaging is performed several days after administration.132 Smaller antibody constructs such as nanobodies, which clear faster, labeled with (half-life: 68 min), allow imaging of tumor uptake within a few hours.133 The prostate cancer biomarker, prostate-specific membrane antigen (PSMA), with efficient targeting of primary prostate cancer and metastatic disease is claimed to be imaging the target of the decade. For such a common disease, PSMA fits the dual role of diagnostic imaging agent and a selective delivery mechanism for a therapeutic agent such as a long-lived beta emitter.134,135 9.Future DevelopmentsThere are a considerable number of current and potential future clinical applications for PET, and in particular demands for whole-body imaging. However, despite all the progress in the technology described above, there are still major technical limitations to realizing this potential, which, therefore, point to the need for even more advances in PET instrumentation. The following points summarize the future opportunities and limitations to achieve these advances:
There are two major definable technical opportunities for expanding the applications of whole-body PET imaging, which, if implemented, promise to provide a step change in the use of PET and the means for finally achieving its full potential. Currently, PET scanners record around 1% of the coincident pairs of photons emitted from the body and the acquired coincidences are stored in listmode as individual events with a time stamp or sorted into arrays (sinograms) from which the 3-D distribution of the tracer can be reconstructed; increasingly reconstruction is now performed directly on the listmode file.139 The level of uncertainty in this reconstruction process increases noise and hence reduces sensitivity. Extending the axial field-of-view of the PET scanner to cover the whole-body would meet many of the desired criteria that were discussed above. This is by no means a new idea and was discussed some 26 years or more ago, a time when whole-body PET scanning was still in its infancy. Current PET scanners have an axial field of view of around 25 cm, so that extending this to some 2 m in length would increase the sensitivity for whole-body PET by a factor of 40.140 With this projected performance, and the clinical applications outlined above, funding has been achieved within the USA-based EXPLORER program to commission the construction of the first total-body PET scanner by United Imaging Healthcare America, a North American Subsidiary of Shanghai United Imaging Healthcare, and SensL Technologies, Cork, Ireland. The device2 is due to become operational in mid-2018. As discussed above, TOF scanners operating at around 400 ps timing resolution have been shown to improve signal-to-noise, but still require a reconstruction algorithm that, unfortunately, intrinsically increases noise. The vision of developing a scintillator–photodetector combination that would achieve 10 ps timing has been launched, which, if successful, would localize the annihilation point to 2 mm and obviate the need for reconstruction. The sensitivity improvement from such an approach would be at least an order of magnitude.141 Attaining a 10-ps timing would open up an entirely new concept of a static partial ring scanner. The partial ring scanner (PRT-1) shown in Fig. 6 rotated to collect a complete data set for tomographic reconstruction. However, with 10-ps timing, reconstruction would not be required and thus a partial ring design could be static, potentially a more cost-effective way to achieve a total-body PET scanner than the full-ring EXPLORER. To summarize, the combination of the geometry of the total-body scanner (EXPLORER) together with ultrashort TOF timing could increase the sensitivity from present day levels by a factor of 400, which would meet the low-dose requirements discussed above. Finally, there is one other potential signal-to-noise increase that could be envisaged. A 70-kg human body comprises 40 kg of soft tissue. A discrete voxel element of 4 mm (current PET scanner resolution) corresponds to . Thus, when acquiring kinetic data from a total-body PET scanner, there are 40,000 possible discrete time-activity curves. If these curves could be averaged to, say, 20 time-activity curves, a significant gain signal-to-noise could be achieved. The selected 20 time-activity curves would then provide the basis to which an SPM-type analysis could be applied to extract perturbations within the normal tissue time-activity data caused by focal pathology. It is interesting to speculate what would be the final overall sensitivity gain from combining a total-body imaging geometry with ultimate TOF and kinetic signal averaging. 10.ConclusionsSince the 1970s, the technical developments in PET instrumentation have resulted in major improvements in image quality for patient studies. These advances, although initially seen to be somewhat costly, have, by opening up new clinical applications, proved ultimately to be cost-effective. There is no reason to believe these advances cannot continue to the extent envisioned above. This progress will come with major technical challenges that must be embraced by physicists, engineers, and the commercial community. The stimulus that will drive these efforts must originate from the promise of unparalleled applications of PET-based molecular imaging in clinical research and healthcare. ReferencesT. Jones,
“The role of positron emission tomography within the spectrum of medical imaging,”
Euro. J. Nucl. Med. Mol. Imaging, 23
(7), 807
–813
(1996). http://dx.doi.org/10.1007/BF00843711 Google Scholar
S. R. Cherry et al.,
“Total-body imaging: transforming the role of positron emission tomography,”
Sci. Trans. Med., 9
(381),
(2017). http://dx.doi.org/10.1126/scitranslmed.aaf6169 Google Scholar
J. J. Vaquero and P. E. Kinahan,
“Positron emission tomography: current challenges and opportunities for technological advances in clinical and preclinical imaging systems,”
Ann. Rev. Biomed. Eng., 17 385
–414
(2015). http://dx.doi.org/10.1146/annurev-bioeng-071114-040723 Google Scholar
Jr. F. R. Wrenn, M. L. Good and P. Handler,
“The use of positron-emitting radioisotopes for the localization of brain tumors,”
Science, 113
(2940), 525
–527
(1951). http://dx.doi.org/10.1126/science.113.2940.525 SCIEAS 0036-8075 Google Scholar
W. H. Sweet,
“The uses of nuclear disintegration in the diagnosis and treatment of brain tumor,”
N. Engl. J. Med., 245
(23), 875
–878
(1951). http://dx.doi.org/10.1056/NEJM195112062452301 NEJMAG 0028-4793 Google Scholar
G. L. Brownell and W. H. Sweet,
“Localization of brain tumors with positron emitters,”
Nucleonics, 11
(11), 40
–45
(1953). Google Scholar
S. Rankowitz et al.,
“Positron scanner for locating brain tumors,”
Inst. Radio Eng., 9 49
–56
(1961). Google Scholar
H. O. Anger and D. C. Van Dyke,
“Human bone marrow distribution shown in vivo by iron-52 and the positron scintillation camera,”
Science, 144 1587
–1589
(1964). http://dx.doi.org/10.1126/science.144.3626.1587 SCIEAS 0036-8075 Google Scholar
C. A. Burnham, S. Aronow and G. L. Brownell,
“A hybrid positron scanner,”
Phys. Med. Biol., 15 517
–528
(1970). http://dx.doi.org/10.1088/0031-9155/15/3/012 Google Scholar
C. A. Burnham and G. L. Brownell,
“A multi-crystal positron camera,”
IEEE Trans. Nucl. Sci., 19
(3), 201
–205
(1972). http://dx.doi.org/10.1109/TNS.1972.4326726 IETNAE 0018-9499 Google Scholar
G. N. Hounsfield,
“Computerized transverse axial scanning (tomography): part 1. Description of system,”
Br. J. Radiol., 46
(552), 1016
–1022
(1973). http://dx.doi.org/10.1259/0007-1285-46-552-1016 BJRAAP 0007-1285 Google Scholar
J. Ambrose,
“Computerized transverse axial scanning (tomography) part 2: clinical application,”
Br. J. Radiol., 46
(552), 1023
–1047
(1973). http://dx.doi.org/10.1259/0007-1285-46-552-1023 Google Scholar
D. E. Kuhl and R. Q. Edwards,
“Image separation radioisotope scanning,”
Radiology, 80
(4), 653
–662
(1963). http://dx.doi.org/10.1148/80.4.653 RADLAX 0033-8419 Google Scholar
D. E. Kuhl et al.,
“Quantitative section scanning using orthogonal tangent correction,”
J. Nucl. Med., 14
(4), 196
–200
(1973). Google Scholar
T. F. Budinger and G. T. Gullberg,
“Three-dimensional reconstruction in nuclear medicine emission imaging,”
IEEE Trans. Nucl. Sci., 21
(3), 2
–20
(1974). http://dx.doi.org/10.1109/TNS.1974.6499234 Google Scholar
D. A. Chesler,
“Three-dimensional activity distribution from multiple positron scintigraphs,”
J. Nucl. Med., 12 347
–348
(1971). Google Scholar
D. A. Chesler,
“Positron tomography and three-dimensional reconstruction technique,”
Tomographic Imaging in Nuclear Medicine, 176
–183 Society of Nuclear Medicine, New York
(1973). Google Scholar
D. A. Chesler and Jr. B. Hoop,
“Transverse section imaging of myocardium with 13NH4,”
J. Nucl. Med., 14 623
(1973). Google Scholar
M. M. Ter-Pogossian et al.,
“A positron-emission transaxial tomograph for nuclear imaging (PETT),”
Radiology, 114
(1), 89
–98
(1975). http://dx.doi.org/10.1148/114.1.89 RADLAX 0033-8419 Google Scholar
M. E. Phelps et al.,
“Application of annihilation coincidence detection to transaxial reconstruction tomography,”
J. Nucl. Med., 16
(3), 210
(1975). Google Scholar
E. J. Hoffman et al.,
“Design and performance of a whole-body positron emission tomograph,”
J. Nucl. Med., 17 493
–502
(1976). Google Scholar
J. O. Eichling, C. S. Higgins and M. M. Ter-Posssian,
“Determination of radionuclide concentrations with positron CT scanning (PETT): concise communication,”
J. Nucl. Med., 18 845
–847
(1977). Google Scholar
M. E. Phelps et al.,
“Tomographic measurements of local cerebral metabolic rate in humans with (F-18) 2-fluoro-2-deoxy-D-glucose: validation of methods,”
Ann. Neurol., 6 371
–388
(1979). http://dx.doi.org/10.1002/(ISSN)1531-8249 Google Scholar
C. W. Williams, M. C. Crabtree and S. G. Burgiss,
“Design and performance characteristics of a positron emission computed axial tomograph—ECAT®-II,”
IEEE Trans. Nucl. Sci., 26
(1 Part 1), 619
–627
(1979). http://dx.doi.org/10.1109/TNS.1979.4329699 Google Scholar
E. J. Hoffman, S. C. Huang and M. E. Phelps,
“Quantitation in positron emission tomography: 1. Effect of object size,”
J. Comput. Assist Tomogr., 3
(3), 299
–308
(1979). http://dx.doi.org/10.1097/00004728-197906000-00001 Google Scholar
S. C. Huang et al.,
“Quantitation in positron emission tomography: 2. Effect of inaccurate attenuation correction,”
J. Comput. Assisted Tomogr., 3
(6), 804
–814
(1979). http://dx.doi.org/10.1097/00004728-197903060-00018 Google Scholar
S. C. Huang et al.,
“Quantitation in positron emission tomography: 3. Effect of sampling,”
J. Comput. Assisted Tomogr., 4
(6), 819
–826
(1980). http://dx.doi.org/10.1097/00004728-198012000-00014 Google Scholar
E. J. Hoffman et al.,
“Quantitation in positron emission tomography: 4. Effect of accidental coincidences,”
J. Comput. Assisted Tomogr., 5
(3), 391
–400
(1981). http://dx.doi.org/10.1097/00004728-198106000-00015 Google Scholar
J. C. Mazziotta, M. E. Phelps and D. Plummer,
“Quantitation in positron emission tomography: 5. Physical-anatomical factors,”
J. Comput. Assisted Tomogr., 5
(5), 734
–743
(1981). http://dx.doi.org/10.1097/00004728-198110000-00029 Google Scholar
E. J. Hoffman et al.,
“Quantitation in positron emission tomography: 6. Effect of non-uniform resolution,”
J. Comput. Assisted Tomogr., 6
(5), 987
–999
(1982). http://dx.doi.org/10.1097/00004728-198210000-00022 Google Scholar
L. Eriksson et al.,
“Evaluation of a high resolution ring detector positron camera,”
J. Comput. Assisted Tomogr., 2
(5), 649
–650
(1978). Google Scholar
S. E. Derenzo et al.,
“Imaging properties of a positron tomograph with 280 BGO crystals,”
IEEE Trans. Nucl. Sci., 28
(1), 81
–89
(1981). http://dx.doi.org/10.1109/TNS.1981.4331144 Google Scholar
E. J. Hoffman, M. E. Phelps and S. C. Huang,
“Performance characteristics of a multiplane positron tomograph designed for brain imaging,”
J. Nucl. Med., 24
(3), 245
–257
(1983). Google Scholar
E. J. Hoffman et al.,
“ECAT III—basic design considerations,”
IEEE Trans. Nucl. Sci., 30
(1), 729
–733
(1983). http://dx.doi.org/10.1109/TNS.1983.4332366 Google Scholar
L. Eriksson et al.,
“A high-resolution positron camera,”
The Metabolism of the Human Brain Studied with Positron Emission Tomography, 33
–46 Raven Press, New York
(1985). Google Scholar
M. E. Casey and R. Nutt,
“A multicrystal two dimensional BGO detector system for positron emission tomography,”
IEEE Trans. Nucl. Sci., 33
(1), 460
–463
(1986). http://dx.doi.org/10.1109/TNS.1986.4337143 Google Scholar
T. J. Spinks et al.,
“Physical performance of the latest generation of commercial positron scanner,”
IEEE Trans. Nucl. Sci., 35
(1), 721
–725
(1988). http://dx.doi.org/10.1109/23.12819 Google Scholar
D. W. Townsend et al.,
“Three dimensional reconstruction of PET data from a multi-ring camera,”
IEEE Trans. Nucl. Sci., 36
(1), 1056
–1065
(1989). http://dx.doi.org/10.1109/23.34605 Google Scholar
T. J. Spinks et al.,
“Physical performance of a positron tomograph for brain imaging with retractable septa,”
Phys. Med. Biol., 37
(8), 1637
–1655
(1992). http://dx.doi.org/10.1088/0031-9155/37/8/002 Google Scholar
S. Grootoonk et al.,
“Correction for scatter in 3D brain PET using a dual energy window method,”
Phys. Med. Biol., 41 2757
–2774
(1996). http://dx.doi.org/10.1088/0031-9155/41/12/013 Google Scholar
D. W. Townsend et al.,
“A rotating PET scanner using BGO block detectors: design, performance and applications,”
J. Nucl. Med., 34 1367
–1376
(1993). Google Scholar
T. J. Spinks et al.,
“Physical characteristics of the ECAT EXACT 3D positron tomograph,”
Phys. Med. Biol., 45 2601
–2618
(2000). http://dx.doi.org/10.1088/0031-9155/45/9/313 Google Scholar
M. Bergstrom et al.,
“Correction for scattered radiation in a ring detector positron camera by integral transformation of the projections,”
J. Comput. Assisted Tomogr., 7 42
–50
(1983). http://dx.doi.org/10.1097/00004728-198302000-00008 Google Scholar
D. L. Bailey and S. R. Meikle,
“A convolution-subtraction scatter correction method for 3D PET,”
Phys. Med. Biol., 39
(3), 411
–424
(1994). http://dx.doi.org/10.1088/0031-9155/39/3/009 Google Scholar
J. M. Ollinger,
“Model-based scatter correction for fully 3D PET,”
Phys. Med. Biol., 41
(1), 153
–176
(1996). http://dx.doi.org/10.1088/0031-9155/41/1/012 Google Scholar
C. C. Watson, D. Newport, M. E. Casey,
“A single scatter simulation technique for scatter correction in three-dimensional PET,”
Three-Dimensional Image Reconstruction in Radiology and Nuclear Medicine, 255
–268 Kluwer, Dordrecht, The Netherlands
(1996). Google Scholar
C. L. Melcher and J. S. Schweitzer,
“A promising new scintillator: cerium-doped lutetium oxyorthosilicate,”
Nucl. Instrum. Methods Phys. Res., A314 212
–214
(1992). http://dx.doi.org/10.1016/0168-9002(92)90517-8 Google Scholar
P. E. Valk et al.,
“Clinical evaluation of an LSO PET system for 3-D whole-body imaging,”
J. Nucl. Med., 42 309P
(2001). JNMEAQ 0161-5505 Google Scholar
K. Wienhard et al.,
“The ECAT HRRT: performance and first clinical application of the new high resolution research tomograph,”
IEEE Trans. Nucl. Sci., 49
(1), 104
–110
(2002). http://dx.doi.org/10.1109/TNS.2002.998689 Google Scholar
J. R. Halama, R. A. Sajdak and R. E. Henkin,
“Performance measurements using the NEMA NU-2 protocol on the ALLEGRA GSO 3-D PET scanner for 18F and 82Rb,”
J. Nucl. Med., 44 111P
(2001). JNMEAQ 0161-5505 Google Scholar
J. S. Karp et al.,
“Benefit of time-of-flight in PET: experimental and clinical results,”
J. Nucl. Med., 49
(3), 462
–470
(2008). http://dx.doi.org/10.2967/jnumed.107.044834 Google Scholar
C. Lois et al.,
“An assessment of the impact of incorporating time-of-flight (TOF) information into clinical PET imaging,”
J. Nucl. Med., 51 237
–245
(2010). http://dx.doi.org/10.2967/jnumed.109.068098 Google Scholar
M. Dahlbom et al.,
“Whole-body positron emission tomography: part I. Methods and performance characteristics,”
J. Nucl. Med., 33
(6), 1191
(1992). Google Scholar
J. S. Karp et al.,
“Three-dimensional imaging characteristics of the HEAD PENN-PET scanner,”
J. Nucl. Med., 38
(4), 636
(1997). Google Scholar
D. Delbeke et al.,
“FDG PET and dual-head gamma camera positron coincidence detection imaging of suspected malignancies and brain disorders,”
J. Nucl. Med., 40 110
–117
(1999). Google Scholar
K. Murthy et al.,
“Results of preliminary clinical trials of the positron emission mammography system PEM-I: a dedicated breast imaging system producing glucose metabolic images using FDG,”
J. Nucl. Med., 41
(11), 1851
–1858
(2000). Google Scholar
S. C. Teixeira et al.,
“Evaluation of a hanging-breast PET system for primary tumor visualization in patients with stage I–III breast cancer: comparison with standard PET/CT,”
Am. J. Roentgenol., 206
(6), 1307
–1314
(2016). http://dx.doi.org/10.2214/AJR.15.15371 Google Scholar
P. M. Bloomfield et al.,
“Three-dimensional performance of a small-diameter positron emission tomograph,”
Phys. Med. Biol., 42
(2), 389
–400
(1997). http://dx.doi.org/10.1088/0031-9155/42/2/010 PHMBA7 0031-9155 Google Scholar
S. R. Cherry et al.,
“MicroPET: a high resolution PET scanner for imaging small animals,”
IEEE Trans. Nucl. Sci., 44
(3), 1161
–1166
(1997). http://dx.doi.org/10.1109/23.596981 IETNAE 0018-9499 Google Scholar
Y. Shao et al.,
“Simultaneous PET and MR imaging,”
Phys. Med. Biol., 42
(10), 1965
–1970
(1997). http://dx.doi.org/10.1088/0031-9155/42/10/010 PHMBA7 0031-9155 Google Scholar
R. Lecomte et al.,
“Initial results from the Sherbrooke avalanche photodiode positron tomograph,”
IEEE Trans. Nucl. Sci., 43
(3), 1952
–1957
(1996). http://dx.doi.org/10.1109/23.507252 Google Scholar
Q. Bao et al.,
“Performance evaluation of the inveon dedicated PET preclinical tomograph based on the NEMA NU-4 standards,”
J. Nucl. Med., 50 401
–408
(2009). http://dx.doi.org/10.2967/jnumed.108.056374 Google Scholar
J. G. Tjuvajev et al.,
“Imaging the expression of transfected genes in vivo,”
Cancer Res., 55
(24), 6126
–6132
(1995). CNREA8 0008-5472 Google Scholar
K. Nagy et al.,
“Performance evaluation of the small-animal nanoscan PET/MRI system,”
J. Nucl. Med., 54 1825
–1832
(2013). http://dx.doi.org/10.2967/jnumed.112.119065 Google Scholar
R. Mersereau and A. Oppenheim,
“Digital reconstruction of multidimensional signals from their projections,”
Proc. IEEE, 62 1319
–1338
(1974). http://dx.doi.org/10.1109/PROC.1974.9625 Google Scholar
R. M. Lewitt, G. Muehllehner and J. S. Karp,
“Three-dimensional image reconstruction for PET by multi-slice rebinning and axial image filtering,”
Phys. Med. Biol., 39
(3), 321
–340
(1994). http://dx.doi.org/10.1088/0031-9155/39/3/002 Google Scholar
P. E. Kinahan and J. G. Rogers,
“Analytic three-dimensional image reconstruction using all detected events,”
IEEE Trans. Nucl. Sci., 36 964
–968
(1989). http://dx.doi.org/10.1109/23.34585 Google Scholar
M. Defrise et al.,
“Exact and approximate rebinning algorithms for 3D PET data,”
IEEE Trans. Med. Imaging, 16
(2), 145
–158
(1997). http://dx.doi.org/10.1109/42.563660 Google Scholar
A. P. Dempster, N. M. Laird and D. B. Rubin,
“Maximum likelihood from incomplete data via the EM algorithm,”
J. R. Stat. Soc. Ser. B (Methodol.), 39
(1), 1
–38
(1977). 0952-8385 Google Scholar
L. A. Shepp and Y. Vardi,
“Maximum likelihood reconstruction for emission tomography,”
IEEE Trans. Med. Imaging, 1
(2), 113
–122
(1982). http://dx.doi.org/10.1109/TMI.1982.4307558 Google Scholar
K. Lange and R. Carson,
“EM reconstruction algorithms for emission and transmission tomography,”
J. Comput. Assisted Tomogr., 8
(2), 306
–317
(1984). Google Scholar
M. Hudson and R. Larkin,
“Accelerated image reconstruction using ordered subsets of projection data,”
IEEE Trans. Med. Imaging, 13 601
–609
(1994). http://dx.doi.org/10.1109/42.363108 Google Scholar
C. Comtat et al.,
“Fast reconstruction of 3D PET data with accurate statistical modeling,”
IEEE Trans. Nucl. Sci., 45
(3), 1083
–1089
(1998). http://dx.doi.org/10.1109/23.681983 Google Scholar
C. Michel et al.,
“Preserving Poisson characteristics of PET data with weighted OSEM reconstruction,”
in IEEE Nuclear Science Symp. Conf. Record,
1323
–1329
(1998). http://dx.doi.org/10.1109/NSSMIC.1998.774398 Google Scholar
C. Comtat et al.,
“OSEM-3D reconstruction strategies for the ECAT HRRT,”
in IEEE Nuclear Science Symp. Conf. Record,
3492
–3496
(2004). http://dx.doi.org/10.1109/NSSMIC.2004.1466639 Google Scholar
X. Liu et al.,
“Comparison of 3-D reconstruction with 3D-OSEM and with FORE+OSEM for PET,”
IEEE Trans. Med. Imaging, 20
(8), 804
–814
(2001). http://dx.doi.org/10.1109/42.938248 ITMID4 0278-0062 Google Scholar
M. Defrise, P. E. Kinahan and C. Michel,
“Image reconstruction algorithms in PET,”
Positron Emission Tomography: Basic Science and Clinical Practice, 91
–114 Springer-Verlag, New York
(2003). Google Scholar
B. Bendriem and D. W. Townsend, The Theory and Practice of 3D PET, Kluwer Academic Publishers(1998). Google Scholar
A. J. Reader et al.,
“Joint estimation of dynamic PET images and temporal basis functions using fully 4D ML-EM,”
Phys. Med. Biol., 51
(21), 5455
–5474
(2006). http://dx.doi.org/10.1088/0031-9155/51/21/005 PHMBA7 0031-9155 Google Scholar
E. Barat et al.,
“A nonparametric Bayesian approach for PET reconstruction,”
in IEEE Nuclear Science Symp. Conf. Record (NSS ’07),
(2007). http://dx.doi.org/10.1109/NSSMIC.2007.4437035 Google Scholar
G. Wang and J. Qi,
“PET image reconstruction using kernel method,”
IEEE Trans. Med. Imaging, 34
(1), 61
–71
(2015). http://dx.doi.org/10.1109/TMI.2014.2343916 Google Scholar
A. Rahmim, J. Qi and V. Sossi,
“Resolution modeling in PET imaging: theory, practice, benefits, and pitfalls,”
Med. Phys., 40
(6), 064301
(2013). http://dx.doi.org/10.1118/1.4800806 MPHYA6 0094-2405 Google Scholar
F. C. Sureau et al.,
“Impact of image-space resolution modeling for studies with the high-resolution research tomograph,”
J. Nucl. Med., 49
(6), 1000
–1008
(2008). http://dx.doi.org/10.2967/jnumed.107.045351 Google Scholar
V. Y. Panin et al.,
“Fully 3-D PET reconstruction with system matrix derived from point source measurements,”
IEEE Trans. Med. Imaging, 25
(7), 907
–921
(2006). http://dx.doi.org/10.1109/TMI.2006.876171 Google Scholar
S. I. Kwon et al.,
“Bismuth germanate coupled to near-ultraviolet silicon photomultipliers for time-of-flight PET,”
Phys. Med. Biol., 61 L38
(2016). http://dx.doi.org/10.1088/0031-9155/61/18/L38 Google Scholar
B. Hasegawa et al.,
“Object-specific attenuation correction of SPECT with correlated dual-energy x-ray CT,”
IEEE Trans. Nucl. Sci., 40
(4), 1242
–1252
(1993). http://dx.doi.org/10.1109/23.256618 IETNAE 0018-9499 Google Scholar
T. Beyer et al.,
“A combined PET/CT scanner for clinical oncology,”
J. Nucl. Med., 41
(8), 1369
–1379
(2000). Google Scholar
P. E. Kinahan et al.,
“Attenuation correction for a combined 3D PET/CT scanner,”
Med. Phys., 25 2046
–2053
(1998). http://dx.doi.org/10.1118/1.598392 Google Scholar
D. W. Townsend,
“Dual-modality imaging: combining anatomy and function,”
J. Nucl. Med., 49
(6), 938
–955
(2008). http://dx.doi.org/10.2967/jnumed.108.051276 Google Scholar
R. A. Bundschuh et al.,
“Post-acquisition detection of tumor motion in the lung and upper abdomen using list-mode PET data: a feasibility study,”
J. Nucl. Med., 48
(5), 758
–763
(2007). http://dx.doi.org/10.2967/jnumed.106.035279 Google Scholar
S. A. Nehmeh et al.,
“Four-dimensional (4D) PET/CT imaging of the thorax,”
Med. Phys., 31 3179
–3186
(2004). http://dx.doi.org/10.1118/1.1809778 Google Scholar
L. L. Geyer et al.,
“State of the art: iterative CT reconstruction techniques,”
Radiology, 276
(2), 339
–357
(2015). http://dx.doi.org/10.1148/radiol.2015132766 RADLAX 0033-8419 Google Scholar
I. Rausch et al.,
“Performance evaluation of the biograph mCT flow PET/CT system according to the NEMA NU2-2012 standard,”
EJNMMI Phys., 2
(1), 26
(2015). http://dx.doi.org/10.1186/s40658-015-0132-1 Google Scholar
H.-P. Schlemmer et al.,
“Simultaneous MR/PET imaging of the human brain: feasibility study,”
Radiology, 248
(3), 1028
–1035
(2008). http://dx.doi.org/10.1148/radiol.2483071927 RADLAX 0033-8419 Google Scholar
G. Delso et al.,
“Performance measurements of the Siemens mMR integrated whole-body PET/MR scanner,”
J. Nucl. Med., 52
(12), 1914
–1922
(2011). http://dx.doi.org/10.2967/jnumed.111.092726 Google Scholar
H. Zaidi et al.,
“Design and performance evaluation of a whole-body Ingenuity TF PET–MRI system,”
Phys. Med. Biol., 56
(10), 3091
–3106
(2011). http://dx.doi.org/10.1088/0031-9155/56/10/013 PHMBA7 0031-9155 Google Scholar
C. Degenhardt et al.,
“The digital silicon photomultiplier—a novel sensor for the detection of scintillation light,”
in IEEE Nuclear Science Symp. Conf. Record (NSS/MIC),
2383
–2386
(2009). http://dx.doi.org/10.1109/NSSMIC.2009.5402190 Google Scholar
C. Spick, K. Herrmann and J. Czernin,
“18F-FDG PET/CT and PET/MRI perform equally well in cancer: evidence from studies on more than 2, 300 patients,”
J. Nucl. Med., 57
(3), 420
–430
(2016). http://dx.doi.org/10.2967/jnumed.115.158808 Google Scholar
D. L. Bailey et al.,
“Combined PET/MRI: from status quo to status go. summary report of the fifth international workshop on PET/MR imaging; February 15–19, 2016; Tübingen, Germany,”
Mol. Imaging Biol., 18
(5), 637
–650
(2016). http://dx.doi.org/10.1007/s11307-016-0993-2 Google Scholar
A. Gustavsson et al.,
“Cost of disorders of the brain in Europe 2010,”
Eur. Neuropsychopharmacol., 21
(10), 718
–779
(2011). http://dx.doi.org/10.1016/j.euroneuro.2011.08.008 Google Scholar
J. C. Baron and T. Jones,
“Oxygen extraction, oxygen metabolism and positron emission tomography: historical perspective and impact on basic and clinical neuroscience,”
Neuroimage, 61 492
–504
(2012). http://dx.doi.org/10.1016/j.neuroimage.2011.12.036 NEIMEF 1053-8119 Google Scholar
R. E. Carson,
“Tracer kinetic modeling in PET,”
Positron Emission Tomography: Basic Science and Clinical Practice, 147
–179 Springer-Verlag, London
(2003). Google Scholar
C. J. Lueck et al.,
“The colour centre in the cerebral cortex of man,”
Nature, 340
(6232), 386
–389
(1989). http://dx.doi.org/10.1038/340386a0 Google Scholar
K. J. Friston et al.,
“Statistical parametric maps in functional imaging: a general linear approach,”
Hum. Brain Mapp., 2 189
–210
(1994). http://dx.doi.org/10.1002/hbm.v2:4 Google Scholar
J. D. G. Watson et al.,
“Area V5 of the human brain: evidence from a combined study using positron emission tomography and magnetic resonance imaging,”
Cereb. Cortex, 3
(2), 79
–94
(1993). http://dx.doi.org/10.1093/cercor/3.2.79 Google Scholar
R. P. Woods, J. C. Mazziotta and S. R. Cherry,
“MRI-PET registration with automated algorithm,”
J. Comput. Assist. Tomogr., 17
(4), 536
–546
(1993). http://dx.doi.org/10.1097/00004728-199307000-00004 Google Scholar
K. K. Kwong et al.,
“Dynamic magnetic resonance imaging of human brain activity during primary sensory stimulation,”
Proc. Natl. Acad. Sci. U. S. A., 89
(12), 5675
–5679
(1992). http://dx.doi.org/10.1073/pnas.89.12.5675 Google Scholar
M. R. Brier et al.,
“Tau and imaging, CSF measures, and cognition in Alzheimer’s disease,”
Sci. Transl. Med., 8 338ra66
(2016). http://dx.doi.org/10.1126/scitranslmed.aaf2362 Google Scholar
S. J. Finnema et al.,
“Imaging synaptic density in the living human brain,”
Sci. Trans. Med., 8
(348), 348ra96
(2016). http://dx.doi.org/10.1126/scitranslmed.aaf6667 Google Scholar
T. Jones and E. A. Rabiner,
“The development past achievements and future directions of brain PET,”
J. Cereb. Blood Flow Metab., 32 1426
–1454
(2012). http://dx.doi.org/10.1038/jcbfm.2012.20 Google Scholar
H. R. Schelbert et al.,
“Reginal myocardial perfusion assessed with N-13 labeled ammonia and positron emission computerized axial tomography,”
Am. J. Cardiol., 43 209
–218
(1979). http://dx.doi.org/10.1016/S0002-9149(79)80006-5 Google Scholar
T. F. Budinger, Y. Yano and B. Hoop,
“A comparison of 82Rb+ and 13NH3 for myocardial positron scintigraphy,”
J. Nucl. Med., 16
(5), 429
–431
(1975). Google Scholar
A. P. Selwyn et al.,
“Relation between regional myocardial uptake of rubidium-82 and perfusion: absolute reduction of cation uptake in ischemia,”
Am. J. Cardiol., 50
(1), 112
–121
(1982). http://dx.doi.org/10.1016/0002-9149(82)90016-9 Google Scholar
P. G. Camici and O. E. Rimoldi,
“The clinical value of myocardial blood flow measurements,”
J. Nucl. Med., 50 1076
–1087
(2009). http://dx.doi.org/10.2967/jnumed.108.054478 Google Scholar
L. Gould et al.,
“Anatomic versus physiologic assessment of coronary artery disease: role of coronary flow reserve, fractional flow reserve, and positron emission tomography imaging in revascularization decision-making,”
J. Am. Coll. Cardiol., 62
(18), 1639
–1653
(2013). http://dx.doi.org/10.1016/j.jacc.2013.07.076 Google Scholar
O. Ratib et al.,
“Positron emission tomography with deoxyglucose for estimating local myocardial glucose metabolism,”
J. Nucl. Med., 23 577
–586
(1982). Google Scholar
E. S. Weiss et al.,
“Quantification of infarction in cross sections of canine myocardium in vivo with positron emission transaxial tomography and -palmitate,”
Circulation, 55 66
–73
(1977). http://dx.doi.org/10.1161/01.CIR.55.1.66 CIRCAZ 0009-7322 Google Scholar
R. M. Allan et al.,
“In vivo experimentation and clinical studies in normal and ischaemic myocardium using []-acetate,”
Circulation, 62
(Suppl. III), 74
(1980). CIRCAZ 0009-7322 Google Scholar
M. Schwaiger et al.,
“Noninvasive evaluation of sympathetic nervous system in human heart by positron emission tomography,”
Circulation, 82
(2), 457
–464
(1990). http://dx.doi.org/10.1161/01.CIR.82.2.457 CIRCAZ 0009-7322 Google Scholar
N. A. Mullani et al.,
“Design and performance of POSICAM 6.5 BGO positron camera,”
J. Nucl. Med., 31
(5), 610
–616
(1990). Google Scholar
R. D. Badawi et al.,
“optimization of noise-equivalent count rates in 3D PET,”
Phys. Med. Biol., 41
(9), 1755
–1776
(1996). http://dx.doi.org/10.1088/0031-9155/41/9/014 PHMBA7 0031-9155 Google Scholar
F. M. Bengel et al.,
“Cardiac positron emission tomography,”
J. Am. Coll. Cardiol., 54
(1), 1
–15
(2009). http://dx.doi.org/10.1016/j.jacc.2009.02.065 Google Scholar
M. Bergstrom et al.,
“Discrepancies in brain tumor extent as shown by computed tomography and positron emission tomography using [68Ga]EDTA, [11C]glucose, and [11C]methionine,”
J. Comput. Assisted Tomogr., 7
(6), 1062
–1066
(1983). http://dx.doi.org/10.1097/00004728-198312000-00022 Google Scholar
K. Kubota et al.,
“Cancer diagnosis with positron computed tomography and carbon-11-labelled L-methionine,”
Lancet, 322
(8360), 1192
(1983). http://dx.doi.org/10.1016/S0140-6736(83)91235-7 LANCAO 0140-6736 Google Scholar
G. Di Chiro et al.,
“Glucose utilization of cerebral gliomas measured by [18F] fluorodeoxyglucose and positron emission tomography,”
Neurology, 32
(12), 1323
–1323
(1982). http://dx.doi.org/10.1212/WNL.32.12.1323 NEURAI 0028-3878 Google Scholar
G. Di Chiro et al.,
“Cerebral necrosis after radiotherapy and/or intraarterial chemotherapy for brain tumors: PET and neuropathologic studies,”
Am. J. Roentgenol., 150
(1), 189
–197
(1988). http://dx.doi.org/10.2214/ajr.150.1.189 Google Scholar
O. Warburg, The Metabolism of Tumors, London(1930). Google Scholar
C. G. Rhodes et al.,
“In vivo disturbance of the oxidative metabolism of glucose in human cerebral gliomas,”
Ann. Neurol., 14
(6), 614
–626
(1983). http://dx.doi.org/10.1002/(ISSN)1531-8249 Google Scholar
K. B. Nolop et al.,
“Glucose utilization in vivo by human pulmonary neoplasms,”
Cancer, 60
(11), 2682
–2689
(1987). http://dx.doi.org/10.1002/(ISSN)1097-0142 CANCAR 0008-543X Google Scholar
A. Gallamini, C. Zwarthoed and A. Borra,
“Positron emission tomography (PET) in oncology,”
Cancers, 6
(4), 1821
–1889
(2014). http://dx.doi.org/10.3390/cancers6041821 Google Scholar
T. Jones and P. Price,
“The development and experimental medicine applications of PET in oncology a historical perspective,”
Lancet Oncol., 13 e116
–e125
(2012). http://dx.doi.org/10.1016/S1470-2045(11)70183-8 Google Scholar
E. C. F. Dijkers et al.,
“-trastuzumab biodistribution and HER2 PET imaging in metastatic breast cancer patients,”
Clin. Pharmacol. Ther., 87
(5), 586
–592
(2010). http://dx.doi.org/10.1038/clpt.2010.12 Google Scholar
R. Chakravarty, S. Goel and W. Cai,
“Nanobody: the ‘magic bullet’ for molecular imaging?,”
Theranostics, 4 386
–398
(2014). http://dx.doi.org/10.7150/thno.8006 Google Scholar
H. R. Kulkarni et al.,
“PSMA-based radioligand therapy for metastatic castration-resistant prostate cancer: the bad Berka experience since 2013,”
J. Nucl. Med., 57 97S
–104S
(2016). http://dx.doi.org/10.2967/jnumed.115.170167 Google Scholar
R. P. Baum et al.,
“177Lu-labeled prostate-specific membrane antigen radioligand therapy of metastatic castration-resistant prostate cancer: safety and efficacy,”
J. Nucl. Med., 57 1006
–1013
(2016). http://dx.doi.org/10.2967/jnumed.115.168443 Google Scholar
P. M. Price et al.,
“Ultra staging to unmask the prescribing of adjuvant therapy in cancer patients: the future opportunity to image micrometastases using total-body 18F-FDG PET scanning,”
J. Nucl. Med., 55
(4), 696
–697
(2014). http://dx.doi.org/10.2967/jnumed.113.133892 Google Scholar
N. V. Joshi et al.,
“18F-fluoride positron emission tomography for identification of ruptured and high-risk coronary atherosclerotic plaques: a prospective clinical trial,”
Lancet, 383
(9918), 705
–713
(2014). http://dx.doi.org/10.1016/S0140-6736(13)61754-7 LANCAO 0140-6736 Google Scholar
A. A. Ordonez et al.,
“A systematic approach to developing bacteria-specific imaging agents,”
J. Nucl. Med., 58
(1), 144
–150
(2017). http://dx.doi.org/10.2967/jnumed.116.181792 Google Scholar
A. J. Reader et al.,
“One-pass list-mode EM algorithm for high-resolution 3-D PET image reconstruction into large arrays,”
IEEE Trans. Nucl. Sci., 49
(3), 693
–699
(2002). http://dx.doi.org/10.1109/TNS.2002.1039550 Google Scholar
J. K. Poon et al.,
“Optimal whole-body PET scanner configurations for different volumes of LSO scintillator: a simulation study,”
Phys. Med. Biol., 57
(13), 4077
–4094
(2012). http://dx.doi.org/10.1088/0031-9155/57/13/4077 Google Scholar
P. Lecoq,
“The route to 10 ps TOFPET is open,”
in IEEE NSS/MIC Conf. Record,
(2016). Google Scholar
BiographyTerry Jones is a medical physicist who initiated the UK’s first PET program in the late 1970s at the MRC Cyclotron Unit at Hammersmith Hospital, London. He undertook developments in PET methodology with industrial collaborators and fostered its applications in a range of clinical areas. He coestablished the state-of-the-art PET-based Wolfson Molecular Imaging Centre at Manchester University. He has more than 300 scientific publications and is currently a visiting professor at the University of California, Davis, California, USA. David Townsend received his PhD in particle physics and was a staff member at CERN in Geneva. He codirected the Pittsburgh PET Facility from 1996 to 2002. In collaboration with Ronald Nutt, he developed the PET/CT scanner, TIME medical invention of the year 2000. He is an IEEE fellow, shared the 2010 IEEE Healthcare Medal, received the 2015 Aebersold Award, and has more than 170 scientific publications. He is currently the director of the Singapore Clinical Imaging Research Centre. |


