
|
|
1.IntroductionMedical image perception research is concerned with the study of the processes of radiologists’ visual search, perception, and cognition, aiming at improving the diagnostic performance. An important way to achieve this is by examining how radiologists actually go about the interpretation of images by conducting eye tracking studies. Past studies that have used eye tracking to analyze conventional radiography have covered extensive research topics, such as radiologists’ reading strategy,1–6 perceptual and cognitive processes during the interpretative process,7–14 differences in gaze patterns of experts and novices and how expert visual search could be trained,15–19 display properties that are associated with superior performance,20–22 the comparison of visual processes when satisfaction of search occurred,23,24 gaze characteristics that are linked to different decision outcomes25,26 and how these could be used to provide perceptually based feedback,27–34 or how lesion properties influence radiologists’ perception and decision making processes.35–39 A number of studies have even looked at how eye tracking studies need to be conducted to yield the most valid results.40–44 Only examples of eye tracking experiments that used conventional radiography were named here due to their large numbers. By contrast, only a limited number of studies have aimed at shedding light on the relationship between visual search, perception, cognition, and performance in the context of volumetric images: five experiments have explored radiologists’ reading strategies of stimulus material that was acquired by a volumetric imaging technique,45–49 while five other studies looked at the influence of expertise on gaze behavior,50–54 four explored the implications of different workstation configurations on gaze,55–59 and one study examined the presence of inattentional blindness in the interpretation of chest CT cases.60 Finally, one study looked at the visual search characteristics of readers when using computer-aided detection in CT colonography presented in the fly through mode. Locations of possible polyps were marked by small dots in the videos of the colon and visual search in these videos was compared to visual search in the same videos in the absence of the cues.61 Considering that volumetric imaging modalities, such as CT, have been used in the clinical practice since the 1970s, it seems surprising that few papers that apply eye tracking to volumetric imaging data seem to have been published. This low amount of previously published research is especially surprising since eye tracking research has flourished in some fields, such as conventional mammography and chest radiography. A possible reason for the lack of studies in this area might be that the eye tracking methodology used in the context of conventional radiography cannot be applied one-on-one to volumetric imaging material. The aim of this paper is to explore some of the experimental challenges that are encountered when conducting eye tracking research with regard to the interpretation of volumetric imaging material. 2.Challenges and Possible Solutions Regarding Eye Tracking in Volumetric ImagesThe challenges comprise the selection of stimulus material, the detection of eye events when analyzing the gaze data, and the subsequent calculation of parameters based on these. These factors have been identified by comparing the 16 papers that deal with eye tracking in volumetric data. Advantages and disadvantages of different solutions will be weighed against each other. The key findings are summarized in Table 1. Table 1Summary of similarities between eye tracking studies in conventional radiography and in volumetric imaging, unique challenges of eye tracking studies regarding the volumetric imaging context and proposed actions to overcome these.
2.1.Stimulus MaterialThe studies that dealt with volumetric imaging material45–61 used images suitable for a three-dimensional representation of the human body, however, the presentation of stimulus material differed between them. Eight of the studies presented all slices of a multislice case and allowed radiologists to scroll freely through these stacks;49,52,55–60 thus, radiologists could scroll back and forth for as long as they wanted to and also determine the pace of their movement through the stack. In two experiments, the radiologists were presented with five consecutive slices of MRI and CT cases, but they were only able to scroll in the forward direction, meaning that once they had chosen to scroll on, they were not able to return to a previous slice.50,51 Four studies chose to present CT colonography fly-through videos rather than individual slices,46,47,53,61 which means that all radiologists who took part in the study saw the slices being presented at the same pace and were unable to adjust the rate or scroll back to a location that was presented earlier. Finally, two studies chose to present single images from CT cases.48,54 In these two experiments, the viewing conditions were hence more comparable to those of eye tracking experiments that deal with conventional radiography images. None of the studies enabled radiologists to set the window, adjust brightness, or image sizes according to their preference. When conducting an eye tracking study, the differences between these four different forms of presentation are immense as they lead to completely different experimental settings. When presenting images consistently in the same order, either as a video or as single static images, viewing conditions are identical and hence directly comparable between readers, meaning that they do not pose an additional source of variance. By contrast, when free scrolling is encouraged, scrolling behavior constitutes a separate factor that might be confounded with the actual research design. Hence, when one is, for example, mostly interested in the study of differences in gaze patterns between experts and novices, different scrolling techniques may introduce additional noise or even influence gaze, such as the amount of dwell that a lesion receives. However, both comparable conditions between readers, as achieved by one-way scrolling, video presentation, and the presentation of single slices, and noncomparable conditions, as created by allowing free scrolling, have their merits. While comparable conditions allow for a more controlled experimental setting and, therefore, for the generation of direct conclusions regarding the influence of manipulated factors in the experiment, free scrolling is closer to the way images are interpreted in the clinical practice and it, therefore, contains a high degree of ecological validity. The conduction of controlled and ecologically valid experiments is naturally most preferable. As this is difficult to achieve simultaneously, the choice should mainly be based on the research question of the experiment. When radiologists’ reading strategy is the focus of the experiment, it might be preferable to design the presentation of the stimulus material to be as close to the viewing conditions that are most common in the clinical practice. When the focus of the experiment, in contrast, lies on pinning down the influence of one or two factors that are manipulated in the experiment, comparable conditions, for example, as ascertained by presenting a video, might be the better choice. However, achieving a good balance between ecological validity and the degree of control that can be ascertained in an experiment is not the only factor influencing the choice between different forms of presentation. The decision of how to analyze the gaze data also has a profound impact on this selection. 2.2.Event DetectionIn studies that employ eye tracking to examine the interpretation of conventional radiography, as well as in most eye tracking studies from other domains, the raw eye tracking samples are not analyzed. Instead, the raw data are usually grouped into fixations and saccades, which are scored by either a dispersion-based algorithm or a velocity-based algorithm. Dispersion algorithms group fixations based on a neighborhood criterion of raw eye tracking samples and usually define a minimum duration for the fixation, while velocity-based algorithms detect saccades by calculating the velocity of a movement by analyzing the distance between two samples. The distinction between the two events, fixations and saccades, is crucial; during saccades, there is usually no visual information processed. Hence, when using the raw data, one must be aware that samples during which the participant could not take in any information might contribute to the estimation of dwell on specific locations. Under many circumstances, the visual input during one fixation is static. When scoring fixations on a conventional radiograph, only and coordinates on the display are taken into account. However, when scoring fixations in a multislice setting, where the visual content is dynamic, i.e., in the presentation of videos or during scrolling, the image content may change during the course of one fixation. This means that even though the eyes do not move, i.e., gaze remains in the same location, the visual input changes. Fixations can nonetheless be detected as in the interpretation of plain radiographs by using the and coordinates on screen, as the distinction between taking in visual information during fixations and suppressing information intake during saccades remains the same. This principle is illustrated in Fig. 1. Fig. 1(a) The calculation of a fixation (indicated by the yellow circle) in conventional radiography is displayed. Only the and coordinates of the raw eye tracking data samples contribute to the scoring of a fixation. (b) A fixation in volumetric images is displayed. Again, the and coordinates of the raw eye tracking data samples contribute to the analysis, regardless of the slice that they fall on. 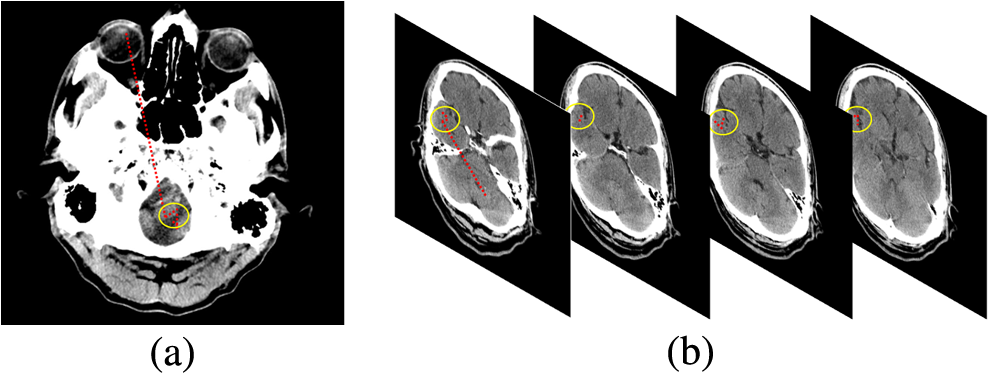 But is this how event detection has been realized in the aforementioned experiments that studied the interpretation of volumetric medical images? The answer to this is mixed. Two studies used only a single image from volumetric cases, thus here fixations were calculated per individual slice.48,54 Conversely, fixations that cover multiple slices were presumably not a problem in experiments where radiologists were only allowed to scroll in one direction, as the time they spent on each slice was relatively long to avoid missing something that they could not get back to.50,51 Five of the studies where scrolling was allowed, distinguished between fixations and saccades,49,52,56–58 but did not explicitly state how fixations were scored. For the majority of them, the relatively short fixation durations that are reported suggest that fixations were calculated per individual slice.49,56–58 Interestingly, six of the studies omitted the calculation of fixations and saccades altogether45–47,60,61 and used raw data instead. While there is no definite right or wrong in the detection of events in eye tracking data, there are problems associated with calculating fixations per slice and the use of raw data: as aforementioned, the use of raw data does not account for saccadic suppression and for this reason, samples are included in the analysis that do not represent the intake of visual information. Furthermore, fixation duration is often used as an indicator of physiological and mental processes, such as fatigue and mental workload. For this end, however, the physiological duration of the fixation is needed, which is only valid when calculated across slices. So what might be the reasons for implementing event detection as it has been done? An important reason for not calculating fixations across slices may be that standard software usually does not allow for the calculation of fixations across slices (see, e.g., OGAMA, SMI BeGaze). All fixations are usually mapped to one of the images or if they are sufficiently long enough to exceed the minimum duration, broken into several fixations that fall on consecutive images. Hence, custom-made software is needed that calculates fixations independent of the imaging material and subsequently maps the proportions of the fixations to the respective slices. This is laborious to implement. Additionally, fixation detection algorithms cannot account for all phenomena that are associated with the interpretation of volumetric medical images. When structures move across the screen, as is the case in fly-through colonography46,47,53,61 or in stack mode slices of large organs as in chest CT,45,60 the eyes perform smooth pursuit movements. Smooth pursuit eye movements are physical movements of the eye, but they are functionally similar to fixations in that they serve to keep visual content stable on the fovea and no suppression occurs. However, unlike fixations, smooth-pursuit eye movements do not have one center as they represent a path. So, while smooth pursuit movements can be detected by velocity-based algorithms that have multiple velocity thresholds, they cannot be mapped to only one location. Hence, if imaging material is used that fosters the performance of smooth pursuit movements, then a possible solution would be to use detection algorithms that allow for the classification of these. For the analysis of temporal characteristics, the detected events can be used. When mapping the eye movements to the specific content, it may, however, be warranted to first exclude all saccades. The raw data of fixations and smooth pursuit movements can subsequently be mapped to the specific image locations to capture visual attention on all structures that are displayed and not just the center of the smooth-pursuit movements. 2.3.Parameter CalculationWhile event detection is at the heart of the analysis of an eye tracking study, the ultimate goal is the calculation of visual search parameters which allow for inferences regarding perceptual and cognitive processes. With slight adaptations, many parameters that have been used in the study of the interpretation of conventional radiography images can be used in the study of the interpretation of volumetric data, too. Here, it is of particular importance that the initially calculated events like fixations and smooth pursuit eye movements, after being calculated across slices, are broken down to account for different durations on different slices. This is important as during scrolling only parts of a fixation might fall onto a lesion. For this reason, only the respective parts should contribute to the calculation of dwell time on the lesion. Similarly, it is important to account for the variable position within the stack where lesions, or more generally areas of interest (AOI), might occur. Hence, parameters that are directly related to this, as the time to first fixation or the decision time, should be calculated from the point in time when the structure of interest is displayed for the first time. Several studies have done this using either the first pursuit of the lesion46,47,53,61 or the first fixation on it59 as the end point as visualized in Fig. 2. The adjustment of the starting point of the calculation is important as it reduces variability in the data, which is quite prominent anyway due to the complexity and variability in the imaging material. Fig. 2The calculation of different gaze parameters which have been adapted for the use in volumetric data. The white circle represents the location of a lesion, whereas the solid arrow in the image represents gaze position and the computer mouse symbolizes the marking of a lesion. The arrows next to the parameters indicate the presentation of slices that contribute to the calculation.  It should be noted that the adjusted parameters are similar to their counterparts which are used in eye tracking studies in conventional radiography, but that they are by no means identical. In the interpretation of conventional radiography, radiologists can always locate lesions peripherally in the interval between the start and the end of the calculation of time to the first fixation or the decision time. In the interpretation of volumetric images, the radiologists may scroll past an AOI. The first display of a slice that features the AOI triggers the start of the calculation of the parameters. Radiologists may then, however, divert their attention to structures that are displayed on other slices and hence have no chance of detecting and reporting the initial AOI until they scroll back. The nature of the parameters is, hence, different in the two contexts (volumetric and conventional radiographs) and it should be assumed that the characteristics of the parameters are, too. In addition to the adaptation of visual search parameters, attempts have been made to account for different behaviors due to scrolling. As has been pointed out, visual content not only changes due to refixation, but also because of slice changes and it has been quantified by the number of slice transitions.56,59 While this parameter is entirely based on scrolling behavior, the number of slices covered by one fixation combines scrolling and eye tracking behavior in one parameter and is assumed to reflect the extent to which radiologists make use of the dynamic properties of stimulus presentation that can be exploited when the resting gaze is stable at one position while scrolling fast through the stack.59 This allows for the use of motion perception processes which single out unexpected structures in the visual field. The two parameters provide insight into the amount of change in image content that is sought by radiologists, whereas other parameters are aimed at the quantification of the direction of change: one study identified two distinct passes that radiologists perform when scrolling through a stack of images. The “locate” pass is used to detect lesions, while the review pass serves to confirm that no lesions were missed.55 This might, however, only apply when the lesions to be identified are particularly conspicuous as otherwise more passes are performed.45,49,59 Another attempt aimed at distinguishing local and global movements through image stacks by quantifying how many slice transitions were performed before the scrolling direction was changed. Local movements, defined to cover a maximum of 25% of slices of a stack, are termed “oscillations” and are assumed to represent the comparison of a single structure across slices. Global movements named “runs” cover more than 50% of the stack and are assumed to aim at the acquisition of an overview.49,59 Note that the particular thresholds may depend on the number of slices and slice thickness of the imaging material. While in the aforementioned studies,49,59 25% of the stack represented a large structure plus a margin of two slices, this might in other contexts cover several organs. The aforementioned studies all aimed at a quantitative description of scrolling. Distinguishing between two types of readers, “scanners” and “drillers,” is a more holistic and qualitative approach to scrolling.45 Scanners are assumed to be readers who search each slice extensively before moving on to the next, while drillers tend to rest their gaze in one quadrant of the stack and scroll through it before doing the same in another quadrant. This is supposedly utilized because fast scrolling in stack mode allows for the use of motion perception processes which single out unexpected structures in the visual field. In this sense, the driller approach is similar to the calculation of the number of slices that are covered by one fixation. Trying to describe scan paths is complex in conventional radiography and the presentation of all static images and parameters that aim at describing these like the earth mover index or chain editing62 only capture parts of it. Finding the right balance between picturing a holistic impression of behavior and breaking it down into individual measureable parts is particularly warranted when describing gaze behavior with regard to volumetric images and it is likely that it will take time and considerable effort to address this in the upcoming years. So far, the paper has concentrated on the gathering and analysis of eye tracking data. However, even a well conducted eye tracking data study remains somewhat ambiguous if no performance data is collected to strengthen claims and assure that diagnostic performance is maintained. The following section will, therefore, focus on how abnormalities can be reported in eye tracking studies. 2.4.Reporting of AbnormalitiesOf the eye tracking studies that looked at the interpretation of volumetric data, only a few have used receiver operating characteristic (ROC) metrics, such as the area under the ROC curve50,51 or the JAFROC figure of merit,59 to assess readers’ diagnostic performances. They did so by asking radiologists to indicate lesion locations on images in a brain atlas after the presentation of the actual stimulus material and rate the case on a confidence scale50,51 or letting readers encircle the lesions in the stimulus material directly and write their confidence rating next to it. The encircling and rating period was tracked and subsequently discarded from the eye tracking analysis.59 The use of the JAFROC figure of merit is particularly suitable for performance analyses in volumetric images as it takes into account the occurrence and diagnosis of multiple lesions, which is likely in large cases. However, instead of using ROC or JAFROC metrics, eight studies simply asked readers to use the mouse to click on abnormalities that they identified.45–48,53,55,60,61 Concurrent verbal reports were used by four studies52,56–58 and one study asked radiologists to indicate the identified lesion on a paper representation of the stimulus images.49 The low number of studies that used ROC metrics is somewhat surprising, considering that ROC and its related techniques are the norm in eye tracking studies in conventional radiography and in studies that relate to medical image interpretation in general. However, challenges associated with the use of the ROC and JAFROC methodology in the interpretation of volumetric images are, for example, that the identification of a lesion often occurs in the middle of the diagnostic process and there needs to be assurance that the perceptual and decision-making phases can be distinguished from the reporting of lesions. To facilitate radiologists’ orientation within a case in experiments where free scrolling is allowed, it may be helpful to let radiologists visibly mark the lesions when reporting them. This is particularly important in cases with multiple lesions where readers are expected to scroll through the case multiple times and may be of lesser importance in experiments that use a cine mode and, therefore, exclude the possibility that a lesion has been seen and reported previously. In eye tracking experiments where lesions span multiple slices, it further needs to be decided on how many slices lesions are supposed to be reported and rated regarding confidence. If only one slice is reported, the size of an AOI is ambiguous, as it is not clear on how many slices the participant would have placed the alleged abnormality. On the other hand, reporting lesions on all slices which they are perceived to span is laborious and interferes considerably with the diagnostic process. A possible solution to this is to ask radiologists to report lesions on only one slice. Regarding true positive and false negative locations, the number of slices on which a lesion is visible, and hence the size of the AOIs, can be determined prior to the study by an independent expert panel. As false positive locations cannot be foreseen, after completing the study, the panel rates how many slices of reported false positive structures are visible.59 3.DiscussionThe review of the various challenges that are faced by eye tracking researchers, who aim at studying gaze in the interpretation of volumetric images, highlights numerous differences between the study of the interpretation of conventional radiographs and that of volumetric cases, but also stresses some parallels between the two. An important challenge is that the analysis of the eye tracking data relies heavily on the development of custom-made software. This is true for event detection as well as for the calculation of gaze parameters, many of which are specific to the context of volumetric imaging. Though all issues that have been reviewed above can be addressed, not all of them can be solved perfectly. There will always be a tradeoff between the ecological validity and the conduction of a highly standardized experiment or between detailed reporting of a lesion and the wish not to interfere with the usual diagnostic process. This is, however, not exclusive to the study of the interpretation of volumetric images and applies to many experimental contexts. The paper has focused on four challenges that, in the eyes of the authors, are the most pressing ones and are directly linked to the conduction of eye tracking experiments. The review of challenges that are associated with the field is, however, not complete. Other important issues relate, for example, to the often low number of cases that are used in eye tracking studies in volumetric imaging, mostly due to increased reading time and resulting time constraints. Furthermore, it has been observed that variability in the eye tracking data may be increased, possibly due to the increased complexity of the stimulus material. When overcoming these challenges, the study of the interpretative process of volumetric images offers numerous prospects and opportunities for research. Only 16 studies could be identified that have used volumetric imaging material and of these only 14 presented the material so that the volumetric properties could be exploited. Overall, in these studies, only five topics have been addressed so far with most studies focusing on radiologists’ reading strategies. This is a striking parallel to the beginning of eye tracking research regarding conventional radiography in the 1960s and 1970s. As eye tracking research in volumetric images slowly increases and the amount of published papers increases in number (eight of the 16 studies have been published in the last 2 to 3 years), more topics will be addressed. While topics that have already been addressed with regard to conventional radiography like lesion conspicuity, gaze pattern related to different decision outcomes, etc., will offer work for many years, maybe the most exciting topics come from the particularities of volumetric imaging such as the use of motion perception and the vast array of volumetric imaging techniques with their respective advantages and challenges. Beyond doubt, the trend toward volumetric imaging will continue in the future and scholars of eye tracking in medical imaging are, therefore, well advised to embrace the challenges and prospects that are offered to them in this field of research. ReferencesJ. Barrett et al.,
“Unobstrusively tracking eye gaze direction and pupil diameter of mammographers,”
Acad. Radiol., 1 40
–45
(1994). http://dx.doi.org/10.1016/S1076-6332(05)80782-2 Google Scholar
D. Carmody, C. Nodine and H. Kundel,
“Finding lung nodules with and without comparative visual scanning,”
Percept. Psychophys., 29 594
–598
(1981). http://dx.doi.org/10.3758/BF03207377 Google Scholar
E. Krupinski,
“Visual scanning patterns of radiologists searching mammograms,”
Acad. Radiol., 3 137
–144
(1996). http://dx.doi.org/10.1016/S1076-6332(05)80381-2 Google Scholar
E. Llewellyn Thomas and E. Lansdown,
“Visual search patterns of radiologists in training,”
Radiology, 81 288
–292
(1963). http://dx.doi.org/10.1148/81.2.288 RADLAX 0033-8419 Google Scholar
C. Mello-Thoms,
“How does the perception of a lesion influence visual search strategy in mammogram reading?,”
Acad. Radiol., 13 275
–288
(2006). http://dx.doi.org/10.1016/j.acra.2005.11.034 Google Scholar
W. J. Tuddenham and W. Calvert,
“Visual search patterns in roentgen diagnosis,”
Radiology, 76 255
–256
(1961). http://dx.doi.org/10.1148/76.2.255 RADLAX 0033-8419 Google Scholar
D. Carmody, C. Nodine and H. Kundel,
“An analysis of perceptual and cognitive factors in radiographic interpretation,”
Perception, 9 339
–344
(1980). http://dx.doi.org/10.1068/p090339 PCTNBA 0301-0066 Google Scholar
H. Kundel, C. Nodine and D. Carmody,
“Visual scanning, pattern recognition and decision making in pulmonary nodule detection,”
Investig. Radiol., 13 175
–181
(1978). http://dx.doi.org/10.1097/00004424-197805000-00001 INVRAV 0020-9996 Google Scholar
H. Kundel et al.,
“Holistic component of image perception in mammogram interpretation: gaze-tracking study,”
Radiology, 242 396
–402
(2007). http://dx.doi.org/10.1148/radiol.2422051997 RADLAX 0033-8419 Google Scholar
H. Kundel et al.,
“Using gaze-tracking data and mixture distribution analysis to support a holistic model for the detection of cancers on mammograms,”
Acad. Radiol., 15 881
–886
(2008). http://dx.doi.org/10.1016/j.acra.2008.01.023 Google Scholar
D. Manning et al.,
“Time-dependent observer errors in pulmonary nodule detection,”
Br. J. Radiol., 79 342
–346
(2006). http://dx.doi.org/10.1259/bjr/13453920 BJRAAP 0007-1285 Google Scholar
C. Mello-Thoms,
“Perception of breast cancer: eye-position analysis of mammogram interpretation,”
Acad. Radiol., 10 4
–12
(2003). http://dx.doi.org/10.1016/S1076-6332(03)80782-1 Google Scholar
C. Mello-Thoms,
“An analysis of perceptual errors in reading mammograms using quasi-local spatial frequency spectra,”
J. Digital Imaging, 14 117
–123
(2001). http://dx.doi.org/10.1007/s10278-001-0010-3 JDIMEW Google Scholar
C. Nodine,
“Time course of perception and decision making during mammographic interpretation,”
Am. J. Roentgenol., 179 917
–923
(2002). http://dx.doi.org/10.2214/ajr.179.4.1790917 Google Scholar
D. Litchfield et al.,
“Learning from others: effects of viewing another person’s eye movement while searching for chest nodules,”
Proc. SPIE, 6917 691715
(2008). http://dx.doi.org/10.1117/12.768812 Google Scholar
D. Litchfield et al.,
“Viewing another person’s eye movements improves identification of pulmonary nodules in chest x-ray inspection,”
J. Exp. Psychol. Appl., 16 251
–262
(2010). http://dx.doi.org/10.1037/a0020082 Google Scholar
C. Nodine et al.,
“Nature of expertise in searching mammograms for breast masses,”
Acad. Radiol., 3 1000
–1006
(1996). http://dx.doi.org/10.1016/S1076-6332(96)80032-8 Google Scholar
C. Nodine, H. Kundel and C. Mello-Thoms,
“How experience and training influence mammography expertise,”
Acad. Radiol., 6 575
–585
(1999). http://dx.doi.org/10.1016/S1076-6332(99)80252-9 Google Scholar
E. Kok et al.,
“Learning radiological appearances of diseases: does comparison help?,”
Learn. Instruct., 23 90
–97
(2013). http://dx.doi.org/10.1016/j.learninstruc.2012.07.004 LEAIE9 0959-4752 Google Scholar
D. Beard et al.,
“A pilot study of eye movement during mammography interpretation: eyetracker results and workstation design implications,”
J. Digital Imaging, 10 14
–20
(1997). http://dx.doi.org/10.1007/BF03168545 JDIMEW Google Scholar
E. Krupinski, H. Roehring and T. Furukawa,
“Influence of film and monitor display luminance on observer performance and visual search,”
Acad. Radiol., 6 411
–418
(1999). http://dx.doi.org/10.1016/S1076-6332(99)80191-3 Google Scholar
E. Krupinski et al.,
“Using a human visual system model to optimize soft-copy mammography display: influence of display phosphor,”
Acad. Radiol., 10 161
–166
(2003). http://dx.doi.org/10.1016/S1076-6332(03)80040-5 Google Scholar
K. Berbaum et al.,
“Gaze dwell time on acute trauma injuries missed because of satisfaction of search,”
Acad. Radiol., 8 304
–311
(2001). http://dx.doi.org/10.1016/S1076-6332(03)80499-3 Google Scholar
S. Samuel et al.,
“Mechanism of satisfaction of search: eye position recordings in the reading of chest radiographs,”
Radiology, 194 895
–902
(1995). http://dx.doi.org/10.1148/radiology.194.3.7862998 RADLAX 0033-8419 Google Scholar
H. Kundel, C. Nodine and E. Krupinski,
“Searching for lung nodules- visual dwell indicates locations of false-positive and false-negative decisions,”
Investig. Radiol., 24 472
–478
(1989). http://dx.doi.org/10.1097/00004424-198906000-00012 INVRAV 0020-9996 Google Scholar
D. Manning et al.,
“Time-dependent observer errors in pulmonary nodule detection,”
Br. J. Radiol., 79 342
–346
(2006). http://dx.doi.org/10.1259/bjr/13453920 BJRAAP 0007-1285 Google Scholar
D. Donovan, D. Manning and T. Crawford,
“Performance changes in lung nodule detection following perceptual feedback of eye movements,”
Proc. SPIE, 6917 691703
(2008). http://dx.doi.org/10.1117/12.768503 PSISDG 0277-786X Google Scholar
T. Donovan et al.,
“The effect of feedback on performance in a fracture detection task,”
Proc. SPIE, 5749 79
–85
(2005). http://dx.doi.org/10.1117/12.593294 Google Scholar
E. Krupinski, C. Nodine and H. Kundel,
“Enhancing recognition of lesions in radiographic images using perceptual feedback,”
Opt. Eng., 37 813
–818
(1998). http://dx.doi.org/10.1117/1.601914 Google Scholar
E. Krupinski, C. Nodine and H. Kundel,
“A perceptually based method for enhancing pulmonary nodule recognition,”
Investig. Radiol., 28 289
–294
(1993). http://dx.doi.org/10.1097/00004424-199304000-00004 INVRAV 0020-9996 Google Scholar
H. Kundel, C. Nodine and L. Toto,
“Searching for lung nodules—the guidance of visual scanning,”
Investig. Radiol., 26 777
–781
(1991). http://dx.doi.org/10.1097/00004424-199109000-00001 INVRAV 0020-9996 Google Scholar
H. Kundel, C. Nodine and E. Krupinski,
“Computer-displayed eye position as a visual aid to pulmonary nodule interpretation,”
Investig. Radiol., 25 890
–896
(1990). http://dx.doi.org/10.1097/00004424-199008000-00004 INVRAV 0020-9996 Google Scholar
C. Nodine, H. Kundel,
“A visual dwell algorithm can aid search and recognition of missed lung nodules in chest radiographs,”
in First Int. Conf. on Visual Search,
399
–406
(1990). Google Scholar
M. Pietrzyk et al.,
“Classification of radiological errors in chest radiographs, using support vector machine on the spatial frequency features of false-negative and false-positive regions,”
Proc. SPIE, 7966 79660A
(2011). http://dx.doi.org/10.1117/12.878740 PSISDG 0277-786X Google Scholar
E. Krupinski,
“Visual search of mammographic images: influence of lesion subtlety,”
Acad. Radiol., 12 965
–969
(2005). http://dx.doi.org/10.1016/j.acra.2005.03.071 Google Scholar
E. Krupinski et al.,
“Searching for nodules: what features attract attention and influence detection?,”
Acad. Radiol., 10 861
–868
(2003). http://dx.doi.org/10.1016/S1076-6332(03)00055-2 Google Scholar
C. Mello-Thoms et al.,
“The perception of breast cancer: What differentiates missed from reported cancers in mammography?,”
Acad. Radiol., 9 1004
–1012
(2002). http://dx.doi.org/10.1016/S1076-6332(03)80475-0 Google Scholar
C. Mello-Thoms,
“Effects of lesion conspicuity on visual search in mammogram reading,”
Acad. Radiol., 12 830
–840
(2005). http://dx.doi.org/10.1016/j.acra.2005.03.068 Google Scholar
C. Nodine et al.,
“Blinded review of retrospectively visible unreported breast cancers- An eye-position analysis,”
Radiology, 221 122
–129
(2001). http://dx.doi.org/10.1148/radiol.2211001507 RADLAX 0033-8419 Google Scholar
S. Littlefair et al.,
“Does the thinking aloud condition affect the search for pulmonary nodules?,”
Proc. SPIE, 8318 83181A
(2012). http://dx.doi.org/10.1117/12.911586 PSISDG 0277-786X Google Scholar
C. Mello-Thoms et al.,
“Head-mounted versus remote eye-tracking of radiologists searching for breast cancer: a comparison,”
Acad. Radiol., 13 203
–209
(2006). http://dx.doi.org/10.1016/j.acra.2005.09.082 Google Scholar
C. Nodine et al.,
“Recording and analyzing eye-position data using a microcomputer workstation,”
Behav. Res. Methods, 24 475
–485
(1992). http://dx.doi.org/10.3758/BF03203584 Google Scholar
W. Reed et al.,
“The effect of abnormality- prevalence expectation on expert observer performance and visual search,”
Radiology, 258 938
–943
(2011). http://dx.doi.org/10.1148/radiol.10101090 RADLAX 0033-8419 Google Scholar
M. Tall et al.,
“Accuracy of a remote eye tracker for radiologic observer studies: effects of calibration and recording environment,”
Acad. Radiol., 19 196
–202
(2012). http://dx.doi.org/10.1016/j.acra.2011.10.011 Google Scholar
T. Drew et al.,
“Scanners and drillers: characterizing expert visual search through volumetric images,”
J. Vision, 13 3
–13
(2013). http://dx.doi.org/10.1167/13.10.3 1534-7362 Google Scholar
E. Helbren et al.,
“Towards a framework for analysis of eye-tracking studies in the three dimensional environment: a study of visual search by experienced readers of endoluminal CT colonography,”
Br. J. Radiol., 87 20130614
(2014). http://dx.doi.org/10.1259/bjr.20130614 BJRAAP 0007-1285 Google Scholar
P. Phillips et al.,
“Tracking eye gaze during interpretation of endoluminal 3D CT colonography: technical description and proposed metrics for analysis,”
Radiology, 267 924
–931
(2013). http://dx.doi.org/10.1148/radiol.12120062 RADLAX 0033-8419 Google Scholar
K. Suwa et al.,
“Analyzing the eye movement of dentists during their reading of CT images,”
Odontology, 89 54
–61
(2001). http://dx.doi.org/10.1007/s10266-001-8186 Google Scholar
A. Venjakob et al.,
“Radiologists’ eye gaze when reading cranial CT images,”
Proc. SPIE, 8318 83180B
(2012). http://dx.doi.org/10.1117/12.913611 PSISDG 0277-786X Google Scholar
L. Cooper et al.,
“Radiology image perception and observer performance: how does expertise and clinical information alter interpretation? Stroke detection explored through eye-tracking,”
Proc. SPIE, 7263 72630K
(2009). http://dx.doi.org/10.1117/12.811098 PSISDG 0277-786X Google Scholar
L. Cooper et al.,
“The assessment of stroke multidimensional CT and MR imaging using eye movement analysis: does modality preference enhance observer performance?,”
Proc. SPIE, 7627 76270B
(2010). http://dx.doi.org/10.1117/12.843680 PSISDG 0277-786X Google Scholar
A. Gegenfurtner and M. Seppänen,
“Transfer of expertise: an eye tracking and thinking aloud study using dynamic medical visualization,”
Comput. Educ., 63 393
–403
(2013). http://dx.doi.org/10.1016/j.compedu.2012.12.021 Google Scholar
S. Mallett et al.,
“Tracking eye gaze during interpretation of endoluminal three-dimensional CT colonography: visual perception of experienced and unexperienced readers,”
Radiology, 273 783
–792
(2014). http://dx.doi.org/10.1148/radiol.14132896 RADLAX 0033-8419 Google Scholar
H. Matsumoto et al.,
“Where do neurologists look when viewing brain CT images? An eye-tracking study involving stroke cases,”
PLoS One, 6 1
–7
(2011). http://dx.doi.org/10.1371/journal.pone.0028928 POLNCL 1932-6203 Google Scholar
S. Atkins et al.,
“Evaluating interaction techniques for stack mode viewing,”
J. Digital Imaging, 22 369
–382
(2009). http://dx.doi.org/10.1007/s10278-008-9140-1 JDIMEW Google Scholar
S. Ellis et al.,
“Thin-section CT of the lungs: eye-tracking analysis of the visual approach to reading tiled and stacked display formats,”
Eur. J. Radiol., 59 257
–264
(2006). http://dx.doi.org/10.1016/j.ejrad.2006.05.006 EJRADR 0720-048X Google Scholar
K. Lång et al.,
“Optimizing viewing procedures of breast tomosynthesis image volumes using eye tracking combined with a free response human observer study,”
Proc. SPIE, 7966 796602
(2011). http://dx.doi.org/10.1117/12.878066 Google Scholar
P. Timberg,
“Investigation of viewing procedures for interpretation of breast tomosynthesis image volumes: a detection-task study with eye tracking,”
Eur. Radiol., 23 997
–1005
(2013). http://dx.doi.org/10.1007/s00330-012-2675-z EURAE3 1432-1084 Google Scholar
A. Venjakob,
“Visual search, perception and cognition when reading stack mode cranial CT,”
Technische Universität Berlin, Digital Dissertations database,
(2015). https://opus4.kobv.de/opus4-tuberlin/frontdoor/index/index/docId/6789 Google Scholar
T. Drew, M. H. Vo and J. Wolfe,
“The invisible gorilla strikes again: sustained inattentional blindness in expert observers,”
Psychol. Sci., 24
(9), 1848
–1853
(2013). http://dx.doi.org/10.1177/0956797613479386 1467-9280 Google Scholar
E. Helbren et al.,
“The effect of computer-aided detection markers on visual search and reader performance during concurrent reading of CT colonography,”
Eur. Radiol., 25 1570
–1578
(2015). http://dx.doi.org/10.1007/s00330-014-3569-z EURAE3 1432-1084 Google Scholar
K. Holmqvist et al., Eye Tracking: A Comprehensive Guide to Methods and Measures, Oxford University Press, Oxford
(2011). Google Scholar
BiographyAntje C. Venjakob studied psychology as an undergraduate and human factors for her masters’ degree. She recently completed her PhD thesis on visual search in medical multislice images and works as a research associate at Technische Universität Berlin, Germany. Claudia R. Mello-Thoms is an associate professor of medical radiation sciences at the University of Sydney and an adjunct professor at University of Pittsburgh School of Medicine. Her research interests are in image perception, visual search, image interpretation, and cognitive modeling of medical decision making. |


