
|
|
1.IntroductionLung cancer is the leading cause of cancer-related death, killing 1.37 million people in the world in 2008 alone.1 While the overall 5-year survival rate of lung cancer is 15.9%, this statistic greatly improves with early diagnosis, up to 52% for the earliest stage of lung cancer.2 The significant improvement in survival with earlier diagnosis has led to the implementation of screening for high-risk asymptomatic individuals, such as smokers and past smokers. Screening by computed tomography (CT) has been found to be an effective technique. The National Lung Screening Trial (NLST) found that using CT to screen for lung cancer reduced lung cancer mortality by 20% compared to screening using projection radiograph.3 However, 96.4% of the nodules marked as suspicious on CT were found to be benign upon further evaluation.4 These false positives result in unnecessary and invasive follow-up procedures and costs while incurring additional emotional stress for the patient. In an effort to reduce the number of false positives, a computer-aided diagnosis (CAD) tool is sought to determine the probability of malignancy of a lung nodule based on objective measurements or features. CAD tools have the potential to improve the accuracy of nodule classification (likely malignant or benign) by acting as a second reader to radiologists.5,6 CAD tools consist of two pathways. In the training pathway, features are extracted from regions of interest (ROIs) with known outcomes, analyzed, and selected for best classification. These selected features are then used to train the classifier. The testing pathway takes an ROI with an unknown outcome. The features selected in the training pathway are extracted from the unknown ROI and passed to the classifier, resulting in the predicted outcome. With the notion that benign and malignant lung nodules will interact with surrounding lung parenchyma differently, we postulate that quantitative CT (QCT) CAD classification of lung nodules can be improved by including characteristics of the lung parenchyma surrounding the nodule. Developing a CAD tool to identify lung cancer is a topic that has been explored in many ways; however, current CAD approaches have focused on the lung nodule itself. In reviewing the current literature, the size, intensity, shape, texture, and location of the nodule have all been found to be significant features in determining the diagnoses of lung nodules.6–22 Several methods have been used to characterize the shape of the nodule including sphericity8,17 and compactness,11,17 as well as qualitative descriptors of polygonal shape,18 edge characteristics,7,19,20 and the presence of spiculation.6,9,13 The texture of the nodule has also been quantified through different techniques, such as co-occurrence matrix-based parameters and run-length statistics.15,16,22 Texture has also been determined through a radiologist scoring system.8 While some of these features are readily computed from the ROIs, such as attenuation properties,10,17,21 volume and size,11,19,20 and sphericity,8,17 other features have been specified based on user input—such as the presence of spiculation6,12,13 and how well-defined the margins of the nodule are.9,14 In summary, the majority of features used in classification have been derived only from the nodule, despite the fact that the nodule interacts with the surrounding parenchyma. The volumetric data from CT imaging facilitates the early detection of small pulmonary nodules (4 to 30 mm) that require follow-up, often with repeated CT imaging to track nodule growth as an indicator of malignancy. A sensitive CAD tool capable of identifying those small nodules as very low risk for malignancy could minimize repeated CT imaging and hence radiation exposure in this population. However, for early identified pulmonary nodules, especially those less than 10 mm, there are a limited number of CT data voxels within the solid tumor, making them difficult to process through traditional CAD tools. Incorporating the surrounding lung tissue in the ROI associated with a lung nodule increases the amount of data available to the CAD tool for feature extraction and contributes insight into the differences between how malignant and benign nodules interact with the adjacent lung parenchyma. 2.Methods2.1.Study PopulationThis was a retrospective study that included 50 solitary pulmonary nodule cases (22 malignant and 28 benign) from previous NIH funded studies: the NLST and the Chronic Obstructive Pulmonary Disease Genetic Epidemiology (COPDGene) study. Our study was approved by the University of Iowa institutional review board, and informed consent of participants was obtained. CT and demographic data were collected as a part of the parent studies. For the NLST study, lung cancer diagnoses were tracked as a part of the primary study outcomes; however, COPDGene subjects were separately contacted and consented in order to collect details related to nodules detected on their CT studies that were acquired to study chronic obstructive pulmonary disease (COPD). Our study consisted of 14 cases from the Iowa cohort of the NLST; 6 nodules were malignant and 8 were benign, all diagnoses confirmed through pathology. The remaining 36 cases—16 malignant and 20 benign—were from the COPDGene study. For 12 of the malignant cases from the COPDGene study, the diagnoses were confirmed using the COPDGene Lung Cancer Registry, an ongoing ancillary study to collect diagnostic and treatment information from participants with both COPD and lung cancer. Additionally, 11 of the benign nodules remained benign after at least 2 years of follow-up. The diagnoses of the remaining four malignant and nine benign nodules from the COPDGene study were determined by comparing the self-reported presence/absence of lung cancer by the participants and the radiologists’ qualitative description of the nodules in their written reports. These 13 nodules will be reassessed upon the return of the participants for stage II of the COPDGene study. 2.2.Computed Tomography DataNLST and COPDGene acquired CT data with very different goals in mind. NLST, targeting annual screening for lung cancer, developed a low-dose protocol to minimize participant exposure to ionizing radiation. The low-dose CT scans from the NLST cohort were acquired from a single center site, the University of Iowa. All 14 NLST scans were collected with a tube voltage of 120 kVp and a tube current–time product of 40 to 80 mAs on either a Philips Mx8000, Siemens Sensation 64, or Siemens Sensation 16 CT machine. While the NLST protocol specified a slice reconstruction interval of 1.0 to 2.5 mm, additional high resolution reconstructions were made at our institution and used in this study.3 The three Philips scans had a slice thickness of 1.3 mm and were reconstructed with a B filter. The Siemens scans had slice thicknesses of 0.75 mm (four scans) or 0.6 mm (seven scans) and were reconstructed with a B30f kernel. The imaging protocol for COPDGene was developed for high resolution lung imaging to best characterize emphysema, air trapping, and airway wall remodeling from the COPD disease process.23 The 36 higher dose CT scans from the COPDGene subcohort were collected from Brigham and Women’s Hospital, Columbia University Medical Center, Morehouse School of Medicine, National Jewish Health, Reliant Medical Group, Temple University, the University of California San Diego, and the University of Iowa. Scans were collected with a tube voltage of 120 kVp and a tube current–time product of 200 mAs. Reconstructions were performed with B, B31f, or Standard kernel for Philips, Siemens, and GE respectively, with slice thicknesses between 0.6 and 0.9 mm. For each of the 50 subjects with an identified solitary pulmonary nodule, the ROI was defined [Fig. 1(a)]. The ROI was selected within the CT data to include the solitary pulmonary nodule and immediate surrounding parenchyma. The amount of parenchyma included in the ROI was roughly proportional to the size of the nodule. Each ROI was manually segmented by a single user (J.U.) to label the individual voxels of the ROI as nodule, surrounding parenchyma, or invalid tissue. In addition, to explore the impact of different segmentations on feature extraction, a subset of 12 cases was independently segmented by three separate users (A.J., S.D., and K.K.). Voxels marked as invalid tissue included chest wall and blood vessels; these voxels were not used in feature extraction. Fig. 1Flowchart of the computer-aided diagnosis (CAD) tool. (a) Segmentation: The region of interest containing the nodule and the surrounding parenchyma is labeled as nodule or parenchyma. (b) Feature extraction: Over 300 features are extracted from these two areas, and an additional 54 global features are extracted based on characteristics of the lung. (c) Classification: Finally, the feature set is reduced and the selected features are used to train the linear discriminant analysis (LDA) and artificial neural network (ANN) classifiers, labeling a nodule as likely malignant or likely benign.  2.3.Feature ExtractionVoxels labeled as parenchyma and nodule were used in the extraction of four classes of features [Fig. 1(b)]: intensity, shape, border, and texture. Intensity characteristics included histogram features, such as mean, minimum, and maximum intensity (in Hounsfield Units), as well as measures of heterogeneity, such as entropy and kurtosis; these were extracted from the nodule and parenchyma voxels separately. Shape characteristics such as sphericity and features comparing the surface of the nodule to a sphere of equivalent volume were extracted using the nodule mask. The size of the nodule was also extracted using the RECIST maximum diameter and the effective radius, calculated from the volume of the nodule. The texture of both the nodule and the parenchyma were each quantified using a three-dimensional (3-D) extension of Laws texture energy measures (TEM).24 These measures interrogate the grey-scale images by looking for patterns in different gradients. In the two-dimensional (2-D) application, five 5-element vectors that describe levels, edges, spots, waves, and ripples are convolved with each other to form 25 called kernels. These kernels locate a different texture type in each dimension, such as edges in the horizontal and spots in the vertical. By convolving the five-element vectors with the 25 2-D kernels, 125 3-D kernels in the form of were generated. These 125 kernels were convolved with each ROI, generating 125 texture volumes that, when combined and normalized to account for the directional texture information, simplified into 34 rotationally invariant 3-D TEMs. Using the same method for intensity feature extraction, the mean, variance, kurtosis, and skewness of the textures for the nodule and parenchyma were extracted for each 3-D TEM. This resulted in 272 texture feature values. A lung CAD tool developed by Way et al.22 examined the nodule border through the use of a rubber band straightening transform, originally implemented by Sahiner et al.25 This process straightens the nodule based on the perimeter identified during segmentation. While the identification of the boundary can vary greatly between users and segmentation methods, the centroid is minimally affected, as illustrated in Fig. 2. Quantitatively, this was tested in the subset of 12 nodules segmented by three different users, yielding a mean centroid difference of . By shifting the straightening from the border of the nodule to the nodule’s centroid, the dependence on segmentation is reduced. To accomplish this task [illustrated in Fig. 3(a)], the axial slice of the ROI containing the centroid was selected. For this 2-D slice, the distance between the centroid and the closest bounding box edge was computed; this length was determined to be the ray length. Rays were cast from the centroid toward the edge of the bounding box radially, resulting in 360 rays of uniform length, with each representing a single row in the straightened image. Once the straightened image was created, the border was analyzed [Fig. 3(b)]. As benign nodules tend to have well-defined borders,26 we expect the average rate of border change to be steeper, indicating a quicker transition to parenchyma. However, for malignant nodules, which tend to be spiculated, it is predicted that the intensity would change more slowly and be more varied across the rows of the straightened image (higher values in both of the variance border features). Fig. 2Comparison of segmentation of a nodule compared to placement of centroid. The nodule (a) was manually segmented by two users: (b) A.J. and (c) S.D. The grayscale image of slice 20 is shown in the top image, while the two segmentations with centroid indicated are shown in the lower images. Though the segmentations differ, the centroid placement remained constant at pixel location (29, 33, 20).  Fig. 3Process for quantifying the border from the straightened image. Nodule straightening: the slice containing the centroid of the nodule mask is selected (a). The minimum distance from the centroid to the bounding box edge is computed [circle in (b)] and rays cast radially for 360 deg [arrow head in (b)]. The intensity values are interpolated along each ray for the straightened image [right panel in (b)]. Each row of the straightened image contains the same number of pixels as the uniform-length cast ray, with the bold line in (b) corresponding to the horizontal line in the row of the straightened image. The same process is repeated for the nodule mask. The straightened mask is combined with the straightened image to remove the invalid tissue (c). Feature extraction: for each row in the straightened image (c), a plot of intensity versus column position is generated (e). Shown by the thick vertical lines, the minimum and maximum column of the border is found from the straightened mask (d). A first-order polynomial was fit for each intensity plot (e) over the column range in (d). The mean and variance of the slopes as well as the width in the border was computed for features (f).  As an additional area of interest, global features were included to determine whether imaging data captured within the same lobe, third of the lung, and/or lung contain meaningful information related to nodule diagnosis. Measures including region-specific (lobe, third, or lung) mean and standard deviation intensity, tissue volume, air volume, and percent emphysema (percent of voxels on inspiratory imaging) were extracted through the commercially available lung analysis software, Apollo Software (VIDA Diagnostics, Inc., Coralville, Iowa). About 54 global measures were included in feature extraction, leading to a total of 165 nodule, 139 parenchymal, and 54 global features. 2.4.Feature Selection and ClassificationThe 358 features collected from the ROIs were then reduced through statistical analysis and feature selection [Fig. 1(c)]. A statistical analysis module was created to determine which of the features were statistically different between the malignant and benign cases. Each feature was tested for normality using the Jarque–Bera normality test. Additionally, the variances for each feature were tested for equality. If the feature followed a normal distribution and the variances for the malignant and benign groups were equal, a two-sample -test for equal variances was performed. If the feature followed a normal distribution but did not have equal variances between the two groups, the two-sample unequal variances -test was used. Finally, if the normality test showed the feature distribution was not normal, the nonparametric Wilcoxon rank sum test was used. A feature with a -value was determined to be statistically significant. This statistical testing was used to reduce the number of features used in feature selection in order to decrease computation time while ensuring meaningful features were included in analysis. To determine which of the significant features should be used for classification, stepwise forward selection was used. A framework was developed for optimizing feature selection when a small number of ROIs were available in an effort to reduce both performance and selection biases (Fig. 4). The performance of the selected features at each step was estimated using leave-one-case-out cross-validation on 49 cases, with the 50th case completely left out of training and testing. This was repeated so every case was completely removed from the process. Majority voting was then used to select the best feature set at each stage of stepwise forward selection. Features were added until the best combination of features was found, with the total number of features equivalent to 1 feature for every 10 ROIs to prevent overfitting;27 with 50 ROIs, features were added until five features were selected or until performance was not improved with the addition of more features. An artificial neural network (ANN), the structure of which is illustrated in Fig. 1(c), was used for classification. Performance was estimated using a leave-one-out cross-validation method where 49 cases were used for training and the 50th used for testing. In the hidden layer, two nodes were used in addition to the bias node. Due to the random initialization of weights during training of the ANN, this was repeated 10 times to better approximate the classifier’s performance. Classification using the features selected was also performed using a linear discriminant analysis (LDA) classifier [Fig. 1(c)]. Due to the deterministic nature of the LDA classifier, the leave-one-out cross-validation method was performed once. Fig. 4Process for selecting the best set of features at each step along stepwise forward selection. For each iteration, one case is left completely out of the internal loop, where accuracy approximations are computed for each subset of features being tested. After acquiring accuracy approximations for all possible subsets for each set of 49 () subcohorts, the feature set with the highest approximate accuracy across all subcohorts is selected. 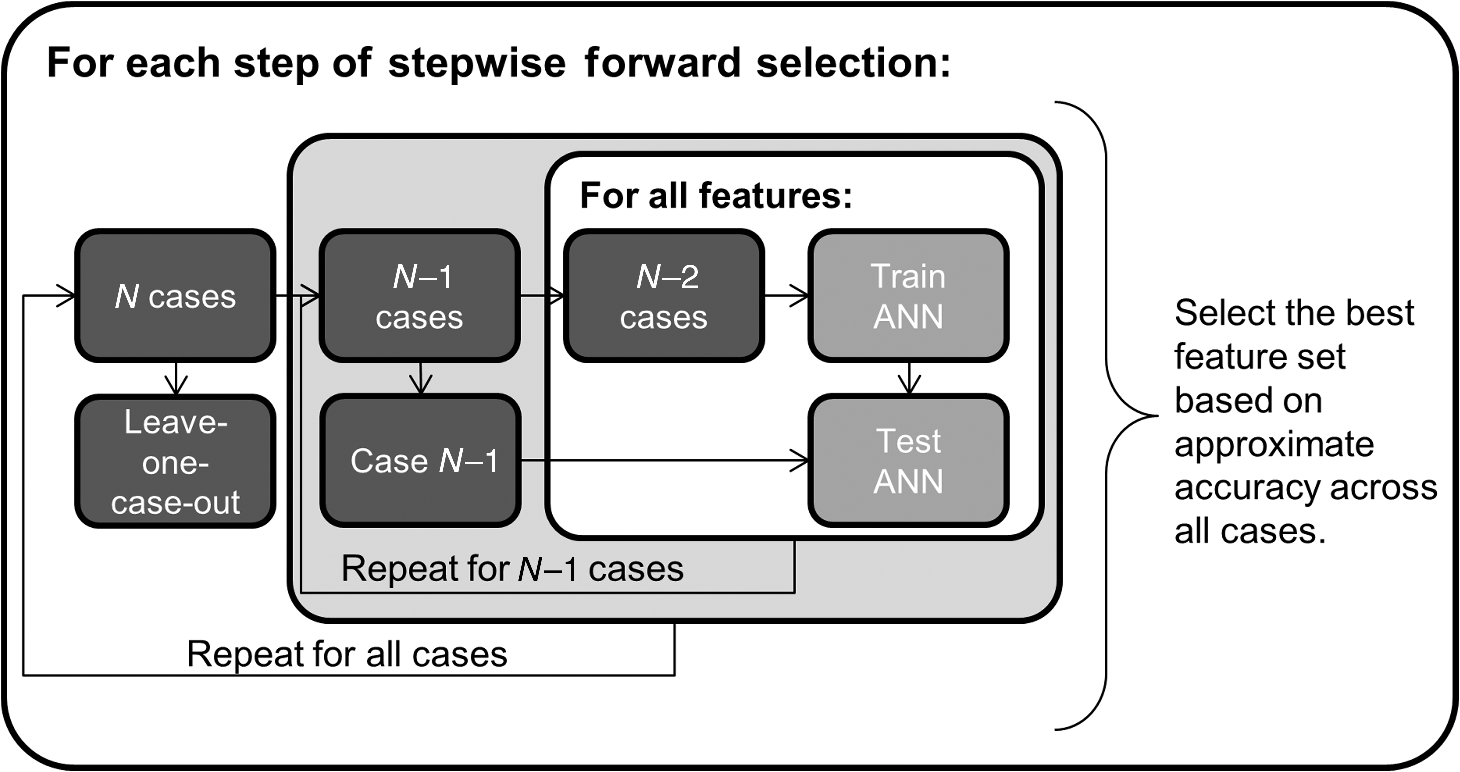 2.5.Classification EvaluationThe accuracy, sensitivity, specificity, and the standard deviations of each measure were computed by averaging the leave-one-case-out cross-validation results from 10 trials with each ANN classifier. Performance was evaluated through ROC analysis in which the area under the ROC curve (AUC) was obtained. Additional performance measures of positive predictive value (PPV) and negative predictive value (NPV) were also computed. Classifier ROC curves were compared using the Delong method to assess for differences in performance.28 Predicted classification probabilities were averaged over the 10 trials for comparisons of ANN performance. All statistical comparisons were two-sided and assessed for significance at the 5% level. 3.Experimental ResultsOverall, the 50 cases ranged in nodule diameter from 4 to 30 mm (). The ROIs had mean dimensions of in the direction, in the direction, and in the or axial direction. The cohort of malignant versus benign nodules had similar distributions of lobar locations with the majority (12 malignant and 19 benign) in the upper lobes. A statistically significant () difference in RECIST maximum diameter as measured by radiologists existed between malignant () and benign nodules (). We expect in the future, especially within the lung cancer screening cohort, that this size bias between the malignant and benign cohorts will not be significant, as we describe in Sec. 4, and hence, in this study, CAD tools were cross compared both incorporating and excluding size features. 3.1.Statistical AnalysisOf the 358 features (165 nodule, 139 parenchymal, 54 global), 52 were found to be significant predictors of malignancy (). In summary, the significant predictors incorporated features from both the nodule and the surrounding parenchyma including the following 47 features:
Comparatively, when only the nodule features were considered, only nine features returned as significant:
There were five significant global features:
The effects of this manual segmentation were analyzed by comparing the feature values across three different segmentations (A.J., S.D., and K.K.). Based on the results of the one-way analysis of variance test, none of the features varied significantly from the others when segmented by a different user. The intensity histogram ( to 1.00) and shape ( to 0.78) features were most affected by manual segmentation, as expected due to reliance on the nodule mask. However, none of the features were statistically significantly affected. 3.2.ClassificationFrom the subset of 47 statistically significant nodule and parenchyma features, the features chosen by stepwise forward selection for the ANN classifier can be seen in Table 1, along with the performance of the classifier using leave-one-case-out cross-validation. Likewise, the features selected for classification from the nine-feature subset for the nodule only are also shown in Table 1. Both classifiers selected the nodule minimum intensity as a feature. While the nodule and parenchyma classifier selected intensity measures of both the nodule and the parenchyma and a shape feature, the nodule-only classifier selected size and border features, in addition to intensity measures. For the nodule-only classifier, only four features were selected when up to five could be used to maintain the 1 feature per 10 cases rule of thumb. In this instance, performance was not improved with the addition of a fifth feature. The ANN built with nodule and parenchyma outperformed that built with features from the nodule alone, correctly classifying 46 of the 50 nodules on average with an average AUC of 0.938, compared to the nodule-only performance of and average AUC of 0.918. Both classifiers had similar sensitivities (90.9% to 93.6%) or to correctly classified as malignant. Table 1Summary of performance measures for the artificial neural network (ANN) classifications. Due to the random initialization of the neural networks during training, performance is reported in percent as the mean ± the standard deviation over the 10 trials. The positive predictive value (PPV), negative predictive value (NPV), and the area under the ROC curve (AUC) are also reported.
As mentioned previously, the classifier built with features only from the nodule selected the size feature: the RECIST maximum diameter. Due to a size bias existing within the cohort, as indicated by the statistical significance of this feature (), the size feature was eliminated from feature selection. Without this feature, the ANN relied on the border feature and nodule intensities and only selected three features before performance was not improved. This ANN had a resulting accuracy of 87.8% () and an average AUC of 0.872 and suffered a reduction in sensitivity and NPV compared to the ANN built with nodule features including size. Overall, the ANNs built with nodule-only features had worsened outcomes, including decreased accuracy, specificity, PPV, and AUC. A final trial looking at the impact of nodule, surrounding parenchyma, and global features resulted in a similar set of features being selected as the nodule and parenchyma CAD tool (Table 1). Instead of parenchyma variance being selected as the fifth feature, the kurtosis of the third of the lung containing the nodule was selected. The ANN incorporating all three types of features (nodule, surrounding, and global) had a performance accuracy of 96.0% (), improved sensitivity and specificity compared to the other classifiers, as well as improved PPV and NPV. It had a similar but reduced AUC compared to that of the nodule and parenchyma ANN, with an AUC of 0.932. Across the four trials, AUCs for the CAD tools using ANN classifiers ranged from 0.872 to 0.938. Their differences were not statistically significant, although the modest sample size in this study limits power to detect small differences. AUCs for LDA classifiers ranged from 0.710 to 0.857 and were significantly lower than those for the ANN classifiers (). A comparison of the ROC curves for these classifiers can be found in Fig. 5. The measures of performances for the LDA classifiers, including the accuracy, sensitivity, specificity, PPV, NPV, and AUC, are shown in Table 2. As seen with the ANN classifiers, the nodule and parenchyma LDA () and the LDA incorporating nodule, parenchyma, and global features () performed better than the LDAs that included only nodule features ( to 0.713), providing additional support for the inclusion of parenchyma features in a CAD tool. Table 2Summary of performance measures for the linear discriminant analysis (LDA) classifications. The accuracy, sensitivity, specificity, PPV, NPV, and the AUC are reported.
4.Discussion and ConclusionExisting CAD tools have focused primarily on characteristics derived from the nodule. These CAD tools may be challenged by early detected lesions due to the limited number of CT voxels within the lung nodule. We sought to overcome this challenge by incorporating parenchyma-derived features. Translation to clinical applicability was also a goal of this CAD tool: as lung cancer screening programs are implemented, a nodule classification approach that performs well regardless of CT scanner manufacturer and variance across image acquisition protocols is desired. Such a system would be able to act as a second reader to a radiologist, providing a quantitative assessment of a nodule in question as well as a likelihood-of-malignancy measure that a radiologist can incorporate into the management plan of a nodule. By utilizing features from the parenchyma as well as the nodule and by incorporating data collected using a diverse range of scanning protocols, we have developed a robust classification tool. Our comparison of classifiers found that the ANN trained with both nodule and parenchymal features trended toward increased performance in accuracy, specificity, PPV, and AUC when compared to performance using features derived from only the nodule, which supports the premise that valuable information can be captured through including parenchymal features. Different CT scanner manufacturers have independent technologies and reconstruction algorithms, which can affect the quantitative, density-dependent grey levels (Hounsfield units) obtained from the CT data. The issue of manufacturer variability in CT data occurs not only in multicenter trials but will also play a larger role as lung cancer screening becomes more widespread. In addition to the diversity in the data due to CT scanner manufacturer, several other factors affect the QCT pulmonary measures, including patient positioning, maximum voltage (kV), tube current–time product (mAs), and reconstruction methods.30 For example, as the mAs increases, the amount of noise is decreased, changing the texture captured within the image. By including scans collected with a diverse number of parameters, including scanner model, tube current–time product, and slice thickness, we have challenged the designed CAD tool: the features selected achieved high performance despite this CT acquisition protocol variability within the cohort. In feature extraction, we sought to take advantage of the volumetric nature of the data by extracting features in three dimensions. One such way was through the Laws’ TEM. First developed in 1980, Laws’ TEM are computed through simple convolutions and moving-average techniques.24 Reports have described techniques for extending Laws’ convolution kernels in several ways, including extension to three dimensions.31 Another research study has used the application of Laws’ TEM to predict prognosis of adenocarcinoma lung tumors, finding no significant differences between high-risk and moderate-risk patients with adenocarcinoma.32 We have expanded the work described in Suzuki and Yaginuma31 to result in 34 rotationally invariant texture image stacks, which we summarized into nodule and parenchyma features, based on the binary masks acquired from the original CT data. We found that textures from the nodules were not significantly different between malignant and benign cases; however, when the parenchyma was examined, texture features were significant. We believe the texture may be quantifying vascularization within the parenchyma, tumor spiculation, and parenchymal tissue compression as the lesion invades into the parenchyma. From the feature selection process, the texture features of the parenchyma were key components in separating diagnoses. Thirty-four of the 52 statistically significant features were texture features derived from the parenchyma. Other parenchymal features were also found to be important during statistical testing, including the variance and the kurtosis of the parenchyma intensity and the kurtosis of the third of the lung containing the nodule. These observations support the hypothesis that inclusion of features from the surrounding parenchyma can aid in the classification of malignant and benign nodules. In addition, features extracted from this straightened image were statistically significant when looking at the nodule alone, indicating the modified straightening of the border from the centroid yields a valid analysis of border characteristics. The parenchymal features’ influence on classification is also important in regards to the size of lung tumors for which the CAD tool was developed. The CAD tool was developed to aid in the classification of nodules, lesions detected in CT with a maximum diameter of 4 to 30 mm. For small pulmonary nodules, especially those , the number of voxels from which nodule features can be computed via CT data is limited. By showing that parenchymal features contribute to a probable diagnosis, the number of voxels that can be used in feature extraction is increased. Additionally, inclusion of the parenchymal features quantifies the reaction of the nodule to its surroundings. The significance of these features further shows that by examining the nodule alone, valuable classification data is being ignored. There is a statistically significant size difference between the malignant and benign nodules in our cohort. Our cohort consists of nodule cases from the NLST and COPDGene clinical trials. The majority (38/50) of nodules included in this study were detected via the first CT time point. This is known as the prevalence time point: nodules detected at this baseline scan cannot be differentiated between asymptomatic existing disease and an early-stage newly developed nodule. Due to the typically rapid growth rate of malignant nodules, these nodules tend to be larger upon detection (incidental or prevalence). However, with yearly lung cancer screening, the goal is to detect newly developed malignant nodules when they are small and localized. The most valuable CAD tool for this screening population will facilitate early diagnosis of CT-identified nodules without requiring longitudinal follow-up imaging and growth pattern data, and hence, the elimination of size bias between the cohorts. While the ANN classifier built from the nodule alone relied on the maximum nodule diameter feature, the classifier that took into account the surrounding parenchyma did not depend on size as a feature. We feel that this indicates potential of this CAD tool’s performance stability across both prevalence and subsequent screening time points. 4.1.LimitationsThe ANN classification approach incorporated a stepwise forward selection method utilizing majority voting. This approach was designed to take advantage of a smaller training dataset while still allowing the maximum number of features to be selected without leading to over-fitting or over-training. While we reported a trend of increased CAD performance through incorporation of parenchymal features, the modest sample size in this study did not allow us to demonstrate statistically significant improvements in AUC. We are currently collecting a retrospective clinical cohort to which this CAD approach will be applied for further testing and validation in a larger cohort. The nodule cases in this study were manually segmented, which is a time-consuming process. However, we present stability of our features despite separate segmentations by three independent users, as support for the adaptability of our system to accommodate automated or semiautomated segmentation approaches in the future. Ensuring accurate truth in the diagnoses of the cases is always a major concern in CAD development. While COPDGene’s primary goal is to study COPD, the identification and determination of lung cancer is a secondary purpose that, until recently, relied heavily on participant reporting. However, recent support has been acquired for the collection of clinical diagnosis, classification, and treatment approach for participants with lung cancer. This ongoing project has led to confirmation of lung cancer diagnoses for 18 of the 22 malignant nodules for the cohort. Additionally, the COPDGene study is currently re-recruiting participants for a second phase of testing (including CT) scheduled for 5-year postphase I testing to assess progression of COPD within the cohort. This has led to 19 of the 28 benign nodules being confirmed as benign with at least 2 years of follow-up. The diagnoses of the remaining four malignant and nine benign nodules will be verified upon the participant’s return for phase II of COPDGene. Additionally, as COPDGene participants return for phase II, we will continue to expand the number of nodules in the cohort to better assess the statistical significance of the differing classifiers' performance. 4.2.ConclusionsIn this study, we report the development of an expanded feature extraction method and accompanying ANN CAD approach for lung nodules detected with CT; incorporating QCT features from not only the solid nodule but also the surrounding lung tissue. The resulting ANN classifier was based on five features—two nodule intensity features, one size feature, and two parenchyma intensity features that also quantify texture and resulted in excellent lung nodule classification (AUC of 0.94, PPV of 0.91, and NPV of 0.93). While the AUC was not improved when global features were included, the PPV and NPV of the nodule, surrounding, and global ANN were improved (AUC of 0.93, PPV of 0.96, and NPV of 0.96). The ANN tools that incorporated only nodule features achieved lower performance values (AUC of 0.92, PPV of 0.85, and NPV of 0.95). This study was underpowered to show statistically significant improvement in the resulting AUC values of the systems, due to a modest sample size. However, the trend toward increased performance when the parenchyma is included, coupled with the large number of significant parenchymal features indicate the value of the developed, expanded QCT feature set. AcknowledgmentsThis research was supported by the American Lung Association Cancer Discovery Award (grant LCD-220717-N) and utilizes data collected by COPDGene, funded in part by the NIH/NHLBI (grants R01 HL-089856 and R01 HL-089897), and NLST, funded in part by the NIH (grants U01 CA-079778 and U01 CA-080098). We thank Kimberly Sprenger, Kristin Knudson, Debra O’Connell-Moore, Carla Wilson, Douglas Stinson, and Laurie Carr for technical assistance. ReferencesN. Howlader et al.,
“SEER Cancer Statistics Review, 1975–2009 (Vintage 2009 Populations),”
1
–39 National Cancer Institute, Bethesda, Maryland
(2012). Google Scholar
D. R. Aberle et al.,
“The National Lung Screening Trial: overview and study design,”
Radiology, 258
(1), 243
–253
(2011). http://dx.doi.org/10.1148/radiol.10091808 RADLAX 0033-8419 Google Scholar
“Reduced lung-cancer mortality with low-dose computed tomographic screening,”
N. Engl. J. Med., 365
(5), 395
–409
(2011). http://dx.doi.org/10.1056/NEJMoa1102873 NEJMBH Google Scholar
K. Doi,
“Computer-aided diagnosis in medical imaging: historical review, current status and future potential,”
Comput. Med. Imaging Graph., 31
(4–5), 198
–211
(2007). http://dx.doi.org/10.1016/j.compmedimag.2007.02.002 CMIGEY 0895-6111 Google Scholar
Y. Matsuki et al.,
“Usefulness of an artificial neural network for differentiating benign from malignant pulmonary nodules on high-resolution CT: evaluation with receiver operating characteristic analysis,”
Am. J. Roentgenol., 178 657
–663
(2002). http://dx.doi.org/10.2214/ajr.178.3.1780657 Google Scholar
M. Gomez et al.,
“Development and testing of multivariate statistical model to predict malignancy of small () pulmonary nodules,”
Am J Respir. Crit. Care Med., 179 A1109
(2009). http://dx.doi.org/10.1164/rccm.200804-615OC AJCMED 1073-449X Google Scholar
D. Zinovev et al.,
“Predicting radiological panel opinions using a panel of machine learning classifiers,”
Algorithms, 2
(4), 1473
–1502
(2009). http://dx.doi.org/10.3390/a2041473 1748-7188 Google Scholar
H. Chen et al.,
“Neural network-based computer-aided diagnosis in distinguishing malignant from benign solitary pulmonary nodules by computed tomography,”
Chin. Med. J., 120
(14), 1211
–1215
(2007). CMJODS 0366-6999 Google Scholar
S. Shah et al.,
“Computer-aided lung nodule diagnosis using a simple classifier,”
Int. Congr. Ser., 1268 952
–955
(2004). http://dx.doi.org/10.1016/j.ics.2004.03.292 EXMDA4 0531-5131 Google Scholar
S. C. B. Lo et al.,
“Classification of lung nodules in diagnostic CT: an approach based on 3-D vascular features, nodule density distributions, and shape features,”
Proc. SPIE, 5032 183
–189
(2003). http://dx.doi.org/10.1117/12.481878 PSISDG 0277-786X Google Scholar
Y. Li and J. Wang,
“A mathematical model for predicting malignancy of solitary pulmonary nodules,”
World J. Surg., 36
(4), 830
–835
(2012). http://dx.doi.org/10.1007/s00268-012-1449-8 WJSUDI 0364-2313 Google Scholar
S. Swensen et al.,
“The probability of malignancy in solitary pulmonary nodules,”
Arch. Intern. Med., 157
(8), 849
–855
(1997). http://dx.doi.org/10.1001/archinte.1997.00440290031002 AIMDAP 0003-9926 Google Scholar
S. Takashima et al.,
“Indeterminate solitary pulmonary nodules revealed at population-based CT screening of the lung: using first follow-up diagnostic CT to differentiate benign and malignant lesions,”
Am. J. Roentgenol., 180 1255
–1263
(2003). http://dx.doi.org/10.2214/ajr.180.5.1801255 Google Scholar
M. F. McNitt-Gray et al.,
“A pattern classification approach to characterizing solitary pulmonary nodes imaged on high resolution CT: preliminary results,”
Med. Phys., 26
(6), 880
–888
(1999). http://dx.doi.org/10.1118/1.598603 MPHYA6 0094-2405 Google Scholar
M. F. McNitt-Gray et al.,
“The effects of co-occurrence matrix based texture parameters on the classification of solitary pulmonary nodules imaged on computed tomography,”
Comput. Med. Imaging Graph., 23 339
–348
(1999). http://dx.doi.org/10.1016/S0895-6111(99)00033-6 CMIGEY 0895-6111 Google Scholar
S. G. Armato et al.,
“Automated lung nodule classification following automated nodule detection on CT: a serial approach,”
Med. Phys., 30
(6), 1188
–1197
(2003). http://dx.doi.org/10.1118/1.1573210 MPHYA6 0094-2405 Google Scholar
S. Takashima et al.,
“Small solitary pulmonary nodules () detected at population-based CT screening for lung center: reliable high-resolution CT features of benign lesions,”
Am. J. Roentgenol., 180 955
–964
(2003). http://dx.doi.org/10.2214/ajr.180.4.1800955 Google Scholar
J. W. Gurney,
“Determining the likelihood of malignancy in solitary pulmonary nodules with bayesian analysis: Part I. Theory,”
Radiology, 186 405
–413
(1993). http://dx.doi.org/10.1148/radiology.186.2.8421743 RADLAX 0033-8419 Google Scholar
J. W. Gurney, D. M. Lyddon and J. A. McKay,
“Determining the likelihood of malignancy in solitary pulmonary nodules with Bayesian analysis. Part II. Application,”
Radiology, 186 415
–422
(1993). http://dx.doi.org/10.1148/radiology.186.2.8421744 RADLAX 0033-8419 Google Scholar
M. Aoyama et al.,
“Computerized scheme for determination of the likelihood measure of malignancy for pulmonary nodules on low-dose CT images,”
Med. Phys., 30
(3), 387
–394
(2003). http://dx.doi.org/10.1118/1.1543575 MPHYA6 0094-2405 Google Scholar
T. W. Way et al.,
“Computer-aided diagnosis of pulmonary nodules on CT scans: Improvement of classification performance with nodule surface features,”
Med. Phys., 36
(7), 3086
–3098
(2009). http://dx.doi.org/10.1118/1.3140589 MPHYA6 0094-2405 Google Scholar
E. A. Regan et al.,
“Genetic epidemiology of COPD (COPDGene) study design,”
COPD, 7
(1), 32
–43
(2010). http://dx.doi.org/10.3109/15412550903499522 Google Scholar
K. I. Laws,
“Rapid texture identification,”
Proc. SPIE, 0238 376
–381
(1980). http://dx.doi.org/10.1117/12.959169 PSISDG 0277-786X Google Scholar
B. Sahiner et al.,
“Computerized characterization of masses on mammograms: the rubber band straightening transform and texture analysis,”
Med. Phys., 25
(4), 516
–526
(1998). http://dx.doi.org/10.1118/1.598228 MPHYA6 0094-2405 Google Scholar
S. Brandman and J. P. Ko,
“Pulmonary nodule detection, characterization, and management with multidetector computed tomography,”
J. Thorac. Imaging, 26
(2), 90
–105
(2011). http://dx.doi.org/10.1097/RTI.0b013e31821639a9 JTIME8 0883-5993 Google Scholar
S. Jarvis, Data Mining with Learner Corpora, John Benjamins Publishing Company, Philadelphia, Pennsylvania
(2011). Google Scholar
E. R. DeLong, D. M. DeLong and D. L. Clarke-Pearson,
“Comparing the areas under two or more correlated receiver operating characteristic curves: a nonparametric approach,”
Biometrics, 44
(3), 837
–845
(1988). http://dx.doi.org/10.2307/2531595 BIOMB6 0006-341X Google Scholar
E. A. Eisenhauer et al.,
“New response evaluation criteria in solid tumours: revised RECIST guideline (version 1.1),”
Eur. J. Cancer, 45
(2), 228
–247
(2009). http://dx.doi.org/10.1016/j.ejca.2008.10.026 Google Scholar
Jr. J. D. Newell, J. Sieren and E. A. Hoffman,
“Development of quantitative computed tomography lung protocols,”
J. Thorac. Imaging, 28
(5), 266
–271
(2013). http://dx.doi.org/10.1097/RTI.0b013e31829f6796 JTIME8 0883-5993 Google Scholar
M. T. Suzuki and Y. Yaginuma,
“A solid texture analysis based on three dimensional convolution kernels,”
Proc. SPIE, 6491 1
–8
(2007). http://dx.doi.org/10.1117/12.705028 Google Scholar
Y. Balagurunathan et al.,
“Reproducibility and prognosis of quantitative features extracted from CT images,”
Transl. Oncol., 7
(1), 72
–87
(2014). http://dx.doi.org/10.1593/tlo.13844 Google Scholar
BiographySamantha K. N. Dilger is pursuing her doctoral degree at the University of Iowa in biomedical engineering. As a graduate research assistant under Dr. Jessica C. Sieren, she has worked to develop computer-aided diagnosis tools seeking to improve the prediction of malignancy of pulmonary nodules at the time of CT screening by utilizing quantitative CT features from the nodule and its surrounding lung tissue. Areas of interest include pattern recognition, image processing, and lung cancer. Johanna Uthoff is pursuing a doctoral degree at the University of Iowa in biomedical engineering. She has worked in the development and preparation of both the high CT resolution research database explored here, as well as a clinical database of lung nodule cases at the University of Iowa Hospitals and Clinics. Her research interests are in machine learning for health-care applications and biomedical imaging. Alexandra Judisch graduated with her MS in biomedical engineering from the University of Iowa in 2015. Her research under Dr. Jessica C. Sieren involved the assessment and validation of quantitative lung airway measurements across multiple computed tomography acquisition protocols and radiation doses. She is interested in medical image data collection, processing, and registration. Emily Hammond graduated with her BSE in biomedical engineering from the Milwaukee School of Engineering in 2012. Since then, she has been pursuing her doctoral degree in biomedical engineering at the University of Iowa under the mentorship of Dr. Jessica C. Sieren. While there, her research has focused on the longitudinal characterization of disease in medical images through multimodality image acquisition and registration. Sarah L. Mott is a biostatistician in the Holden Comprehensive Cancer Center at the University of Iowa. She provides statistical programming and data analysis support for HCCC members. In general, she participates in the design of studies, assists in judging the validity of data and the selection of appropriate analytic methods, implements and applies statistical computing programs, and prepares statistical analysis sections for grant applications, manuscripts, and presentations. Brian J. Smith is an associate professor in the Biostatistics Department and director of biostatistics in the Holden Comprehensive Cancer Center at the University of Iowa. He is involved in the design and conduct of a broad range of cancer research, including preclinical, clinical, and epidemiologic studies. He teaches courses in biostatistical computing, methods, and applications. His methodological areas of expertise include statistical computing, Bayesian methods, correlated data, and statistical modeling. John D. Newell Jr., tenured professor of radiology and biomedical engineering, holds leadership positions in several imaging programs at the University of Iowa. He is a board-certified diagnostic radiologist with a fellowship in cardio-pulmonary radiology and over 30 years’ experience in clinical research and clinical practice in cardio-thoracic radiology. He is a coinvestigator and member of the imaging cores of the COPDGene Multicenter NHLBI research study and the SPIROMICS Multicenter NHLBI research study. Eric A. Hoffman, tenured professor of radiology, medicine, and biomedical engineering at the University of Iowa, has core interests in the uses of advanced imaging methods to study normal and pathophysiology of the lung, focusing on lung mechanics and ventilation/perfusion relationships. His laboratory also provides analysis tools, coordination, quality control, and image analysis to support multicenter studies whereby lung imaging serves as a phenotype, outcomes measure, or safety test to assess COPD and asthma. Jessica C. Sieren is an assistant professor of radiology and biomedical engineering at the University of Iowa. Her research interests include advanced medical image acquisition and analysis techniques for the improved, minimally invasive characterization of lung cancer and associated lung diseases, such as chronic obstructive pulmonary disease. |
||||||||||||||||||||||||||||||||||||||||||||||||||||||||||||||||||||||||||||||||||||||||||||||


