|
|
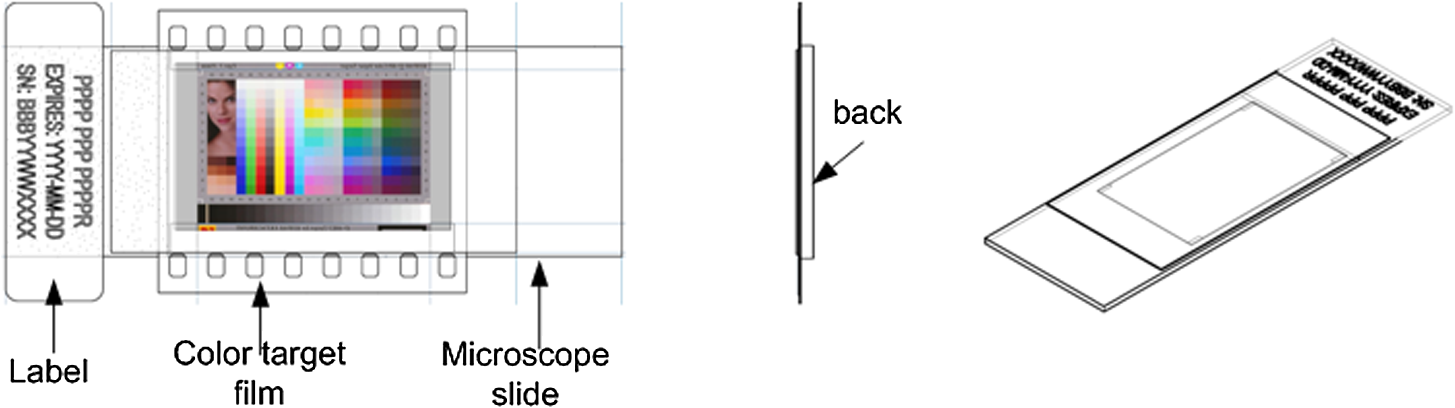
1.IntroductionWhole slide imaging (WSI) scanners produce high-res images, which are easy to visualize and navigate at different magnification levels. Since color content of an image has a direct influence on the readers’ performance and the reliability of the clinical diagnosis,1,2 the scanner reproduced colors should be accurate and consistent. However, the same slide scanned by different scanners may appear different, even when viewed on the same display device, due to discrepancies in their color characteristics and configuration. The color standardization and validation of WSI, including the scanner color reproduction, is a well-recognized issue.3 However, color standardization is nontrivial mainly because the field of color perception and preference is highly subjective. Furthermore, WSI involves multiple devices, such as scanner and display, with different color characteristics. The color transformations across different devices involve complex procedures and each transformation may introduce loss in color information. In this paper, we focus on color calibrating the WSI scanners and rendering the scanned colors to the standard sRGB color space of a display device. 1.1.Related WorkExisting literature on WSI color reproduction is related to microscopes and digital scanners. A multispectral-based technique is proposed by Tani et al.4 for microscope color calibration using H&E stains. The reference colors are derived from specimens as spectral signals via a spectral sensor. The Red-Blue-Green triplet (RGB) color values of the specimen, captured using a standard microscope, are decomposed into multiple spectral bands and correlated to the reference to obtain the desired color correction. The technique is applicable also to the WSI scanner, but it requires color measurement using a multispectral sensor and the scanner should be calibrated separately for different stain types. The color variation in the display devices of WSI is evaluated by Yagi3 using two phantom slides: one consisting of nine color patches and another containing an H&E stained mouse embryo. The scanned images of the phantoms are visualized in multiple display devices of the same model. A display analyzer is used for reading the RGB/HSL (Hue-Saturation-Luminance) values of the color patches from the displays. The result shows a significant variation among the display devices and advocates the need for display color calibration and WSI standardization. However, the paper does not address the means to achieve color accuracy in a scanner and reproducibility of the phantom slides. The proposed phantom slides by Yagi3 are employed in calibrating and evaluating a WSI scanner by Murakami et al.5 The colorimetric values of the patches used in the phantom slides are obtained by spectrometer reading. A color calibration matrix of a size, is derived by correlating the scanned color values of the phantom and their corresponding colorimetric values. The calibration matrix is used in mapping the scanner raw-RGB colors to device-independent XYZ values. The results show a visual improvement in color representation on H&E slides. The performance of both of the phantom slides is similar. The authors recommend the use of phantom slides for color calibrating the WSI scanner. The color performance of WSI scanners is assessed by using a self-made color phantom slide by Cheng et al.6 The authors manufacture a phantom slide by taking a photograph of the GretagMacbeth ColorChecker SG on a photographic transparency film and mounting the film on a glass slide. The colorimetric values of the captured 140 color patches are derived by measuring the spectral transmittance of the individual patches using a spectroradiometer. The phantom slide is scanned by a WSI scanner and the reproduced colors are obtained by intercepting pixel data from the input of the display device. The difference between the scanner reproduced colors and the spectrally measured colorimetric values is computed using a CIE76 formula. The results show a pronounced color difference for certain patches when color management is activated and the results are even worse without color management. The paper does not address improving color accuracy in a WSI scanner and achieving reproducibility of the phantoms. 1.2.International Color Consortium Color WorkflowThe international color consortium7 (ICC) specifies a cross-platform workflow for color reproduction, which has been adopted by many color management systems (CMS). The ICC workflow consists of determining the color characteristics of a device based on its color response to a known target or phantom. The color characteristics are represented according to the standard format called ICC profile, including the mathematical transformation of the device-dependent RGB colors to/from the CIE XYZ color space, also called the device-independent color space or profile connection space (PCS). The mathematical transformation, also called calibration information, is computed by correlating the phantom colors captured by a scanner (raw RGB) with the reference colorimetric values using data-fitting techniques such that the difference between device-independent colors and the reference is minimized. Figure 1 shows the color calibration and profiling process, where the scanner RGB colors and reference colorimetric values of the phantom are used to produce the scanner color calibration information and profile. According to the ICC standard, the calibration information is embedded in the ICC profile. In the context of WSI, the following three ICC specific methods are applicable for scanner calibration and profiling: LUT-based, TRC-matrix and matrix-only methods. The LUT-based approach uses nonlinear mapping where the input scanner RGB colors are mapped to XYZ values using a look up table. The TRC-matrix and matrix-only approaches use a linear fitting in combination with and without a tone reproduction curve (TRC), respectively. The TRC is used for compensating the nonlinear behavior of a device regarding brightness. The colors reproduced by a WSI scanner are required to be mapped to the display device, which is generally based on the standard sRGB color-space with gamma.8 The transformation from XYZ color space to sRGB color space also involves addressing the colors which are out of range of the sRGB space and adjusting the white point. According to the application, the ICC standard specifies the following techniques, called rendering intents, for mapping colors in sRGB: “perceptual” for pleasant visual quality, “saturation” for vibrant colors, and “colorimetric” for color accuracy. In the colorimetric rendering intent, the out-of-range colors are simply clipped. The perceptual and saturation rendering intents are available only in the LUT-based color profiling. The TRC/matrix-based ICC profiles allow two colorimetric rendering intents, namely “absolute” and “relative.” In the absolute colorimetric rendering, the white point remains the same as is specified in the ICC profile, while in the relative colorimetric rendering the white point is adapted to that of an output medium. 1.3.Our ApproachIn this paper, we propose a workflow for color reproduction in WSI scanners such that the colors in the produced images are close to the actual color of the input slide and the inter-scanner variation is minimum. We prepare a color phantom slide based on a standard Kodak Q60 (IT8) target transmissive film, manufactured by Eastman Kodak Company, Rochester, New York. The film contains 264 color patches and 24 skin tones as shown in Figure 2. The colorimetric values of the color patches are provided by the target film manufacturer. We further investigate different existing ICC specified methods to calibrate the WSI scanners and to render the scanner colors to the standard display (sRGB) color space. We transform the scanner XYZ values to sRGB color space followed by the gamma correction. Figure 3 shows the color reproduction process during a slide scan, where the raw scanner RGB colors are converted into the display sRGB colors. The raw scanner colors are first adjusted according to the color calibration information obtained from the scanner calibration/profiling, and transformed into the device-independent XYZ color space. Next, the colors are transformed into the linear sRGB space according to the given rendering intent and finally, they are gamma corrected for visualization. Fig. 3Color reproduction process in a WSI scanner during a tissue slide scan. The scanner color calibration information is derived, as described in Fig. 1. 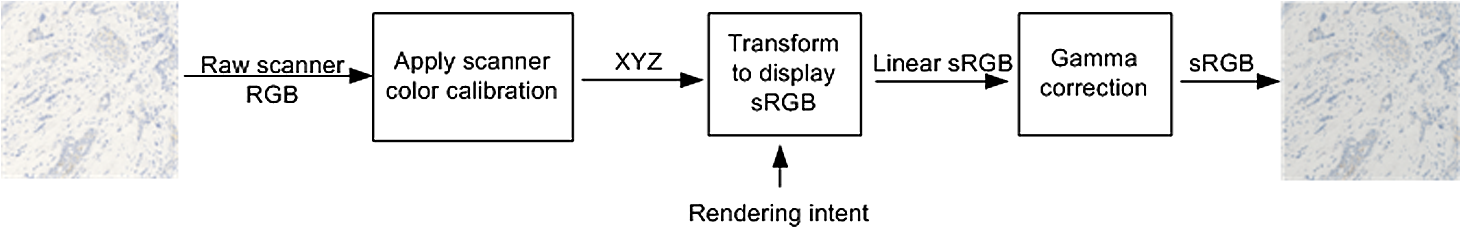 We evaluate the performance of the proposed workflow in terms of (1) phantom slide reproducibility, (2) scanner color accuracy, and (3) inter-scanner color reproducibility. The color difference corresponding to the accuracy and reproducibility measurements is computed using CIE DeltaE-2000 metric.9 2.Method2.1.Color Phantom Slide PreparationA phantom slide plays a very important role in scanner color reproduction as it is used as a reference to calibrate the raw-RGB colors. It should contain an adequate number of patches, representing a wide range of relevant colors and grayscales to pathology. However, due to the unavailability of such standard colors in pathology, we use the Kodak Q60 35 mm transmissive film, which is widely used in digital cameras and desktop scanner calibration. The film is manufactured in accordance with ANSI IT8.7/1 (transmission) standard. As shown in Figure 2, it contains 252 IT8.7 patches (A1:19–L1:19) and 36 Kodak specific patches. The colorimetric values of all the patches are provided by the manufacturer. The tolerance of 99% of the patches is specified to be below the just noticeable difference.10 The film is embedded on a glass slide so that the optical property of the histopathology slides is retained by the phantom. The film is trimmed along the borders to fit between the microscope glass slide measuring 1 mm thick, and a 0.2-mm thick glass cover slip. Figure 4 shows the basic structural design of the target slide from different viewing angles. Ideally, all the phantom slides should conform precisely to the reference color values provided by Kodak and should maintain their color behavior. However, in practice, the reproducibility of the slides is found to be influenced by the medium between the glass and the film. When the film was prepared by using adhesive at the corners of the glass, the presence of air-created interference patterns, called Newton’s rings due to the reflection of light among multiple surfaces: slide-air, air-film, film-air, and air-cover. Moreover, the patterns change with time, depending on the temperature and surface pressure, resulting in corrupted color profiles. When an organic oil with a matching optical index was used to replace the air, the double-sided tapes used in sealing the slide borders were weakened with time causing leakage. Both the air and oil-based phantom slides, performing well at the time of manufacturing, turned out to be unsuitable for long-term practical use. Therefore, we opted for an adhesive-based phantom slide in which the film is glued with the glass slide and the cover glass by means of a transparent epoxy-based adhesive with a matching index, leaving no empty area. 2.2.Color Difference ComputationIn this paper, we measure color difference in terms of subjective and objective evaluations. The subjective evaluation involves visual inspection of the color images by the authors and people with experience in image processing. The objective evaluation of color difference is computed using a mathematical formula, which represents the perceptual distance between two colors. Due to its superior performance and a wide acceptance in industrial applications, we use the CIE-2000 color difference equation,11,12 given by DeltaE or . A DeltaE value of 1 or less is considered to be visually imperceptible, while higher values represent larger differences. The DeltaE equation is developed for the CIE LAB color space. The color space is designed to be perceptually uniform, such that a change of the same amount in a color value produces a change of about the same visual importance. Any two colors whose difference is to be computed is transformed into the LAB color space. The mathematical transformation to and from the LAB values is available online.13 The between the two colors given by and is calculated as where, represents lightness, and and represent the color components., , and are parametric weighting factors used as constant values equal to 1. , , and are lightness-, chroma-, and hue-dependent scaling functions, respectively. The functions are derived from CIE color difference datasets. is an additional scaling function that depends on chroma and hue. , , and represent the lightness, chroma, and hue differences, respectively. The difference formula is symmetric. Readers are referred to Sharma11 for the details of the formula. 2.3.Whole Slide Imaging Scanner Color ReproductionA WSI scanner color reproduction involves transforming scanned raw RGB pixels according to the calibration coefficients and mapping them to the display color space. The reproduced colors should accurately represent the color of the scanned tissue slide and should be consistent among multiple scanners. We follow a generic ICC compliant approach of color reproduction as described in Sec. 1.2, based on the scanner calibration and profiling. We scan a phantom slide from an optimal focus height, which is different than that for a tissue slide due to the difference in thickness of the target film (0.1 mm) and tissue specimen (typically, 0.0005 mm). We use an open source Argyll color management system14 for the WSI scanner calibration and profiling based on the popularity and performance of the tool in comparison to other vendors.15 Given a scanned image of the phantom, the software detects the patch areas and extracts the corresponding RGB colors. The color extraction is based on the robust mean approach, which computes the most representative color against the structural noise due to the film. The extracted colors are correlated with the reference colorimetric values according to a given calibration/profiling method, resulting in a scanner profile and color calibration information. For example, in the matrix-only calibration method used in Argyll,14 an optimal color calibration matrix is computed by minimizing the sum of the squares of DeltaE between the reference colorimetric values and the model predicted values. The minimization function can be represented as: where , , and are derived from their corresponding XYZ values by applying a candidate calibration matrix to the scanned RGB colors. Finally, an optimally computed matrix of size is applied to transform the scanned raw-RGB values, , , and , to device-independent XYZ values:The scanner colors, represented so far in the XYZ color space are rendered to the standard sRGB color space for displaying. The XYZ color values are based on the illuminant D50, according to the ICC profile. Since the sRGB color space is based on the illuminant D50, we covert the illuminant D50 to D65 using Bradford transformation matrix.13 3.Test Results and DiscussionsWe conducted experiments to evaluate the effect of different ICC color calibration/profiling methods and rendering intents in the context of WSI. The experiments involved scanning the phantom slide with the Philips WSI scanners, called the Ultra Fast Scanners (UFS), generating an ICC profile and calibration information using different methods, applying the calibration information on the scanned images to compute scanner reproduced colors, and evaluating the colors. We aim to objectively measure:
The details of the evaluation results and a discussion on the above-mentioned five experiments are described in Secs. 3.1–3.5. The experiments include 35 UFSs and 14 phantom slides. We use in total 264 patches, which in include all the color and grayscale patches in the phantom except for the ones containing skin (A20:22-H20:22). The results are presented in terms of mean and standard deviation across the patches or scanners; and percentage of patches with DeltaE less or equal to 1. 3.1.Calibration/Profiling Method SelectionThe following ICC calibration methods are applied to the UFSs: LUT-based, TRC-based and matrix-only methods, using the phantom slide. The measured color difference in terms of mean DeltaE between the scanner generated device-independent phantom slide colors and the reference using LUT-based, TRC-based, and matrix-only methods are: , , and , respectively. These results show that the LUT-based method, followed by the TRC-based method, results in a better fit. However, when the methods are applied in tissue scans with the corresponding rendering intents, the colors reproduced by the LUT-based and TRC-matrix methods are perceived as un-natural. Furthermore, the colors reproduced by different scanners appear to be inconsistent. The tissue images reproduced using the matrix-only method appears to be more visually natural and consistent among scanners. Figure 5 shows an example tissue sample reproduced by two scanners using different combinations of ICC profile and rendering intents. Fig. 5A segment of a tissue slide scanned by two UFSs, given in two rows, and reproduced using different ICC profile/calibration approaches and rendering intents. (left to right) raw-RGB; LUT-based and perceptual rendering; TRC-matrix and absolute colorimetric rendering; matrix-only and relative colorimetric rendering; and matrix-only and absolute colorimetric rendering.  The difference in the reproduced color quality of the phantom and the tissue slides may be due to overfitting and locally optimized parameters computed by the calibration methods. To test the degree of overfitting, we divide the phantom patches into two equal sets by random selection. One of the sets is used in deriving the calibration parameters and the other set is used in testing the fit. If a method results in a nonoverfitting optimal solution, the difference between the reproduced and the reference colors upon applying the calibration parameters in the two sets would be minimal. In the LUT-based method, the set included in deriving the calibration parameters shows a mean DeltaE of , while the other set shows a mean DeltaE of . However, in the matrix-only method, the set used in the calibration shows a mean DeltaE of and the other set shows a mean DeltaE of . The difference between the two sets in the LUT-based and the linear matrix-only methods are found to be 1.5 and 0.1 DeltaE, respectively. This shows that the calibration parameters generated by using the LUT-based method are overfitting. Since the image sensor used in WSI scanner is a linear device, the nonlinear methods may not provide an optimal fit. In the linear matrix-only approach, the chance of overfitting the data is negligible because only nine coefficients, in the form of a matrix, are derived from the 264 data points. The calibration parameters locally optimized for a phantom slide may not be applicable to tissue images due to dissimilarities in the design of a phantom and a tissue slide. Our phantom slide is based on a film target with patch colors which are different than the ones used in tissue specimen in pathology. As a result, the calibration parameters locally optimized for a phantom cannot accurately reproduce the tissue colors. The problem of local optimization can be avoided by using a phantom whose colors and characteristics match to that of a pathology slide. 3.2.Rendering Intent SelectionGiven the matrix-only calibration method, the ICC specification allows relative and absolute colorimetric rendering intents. If images produced by any of the two intents are viewed in isolation, no noticeable differences are perceived due to the chromatic adaptation in the human visual system. However, if viewed side by side, as shown in Fig. 5, a subtle shift in the white balance becomes visible. The absolute rendering method produces visually more uniform results among multiple scanners. Figure 6 shows the -chromaticity diagram of a phantom slide containing 264 color patches scanned by a UFS and based on CIE 1931. It illustrates the patch colors in two-dimensions without the luminance information. Since the color space of a UFS is wider than that of the sRGB, the range of colors that can be reproduced in our workflow is not limited by the UFS. As shown in the figure, there are a few color patches slightly out of the sRGB range. The absolute colorimetric rendering intent simply clips these colors. However, the resulting color difference is less than 1 DeltaE. It shows that the scanner color reproduction is minimally affected by the color clipping. Considering the color reproducibility required by the scanners and a minimum loss in rendering, we recommend the use of a matrix-only based ICC profile and absolute colorimetric rendering intent. Fig. 6Chromaticity diagram of a UFS. The range of the scanner and display color space are represented by normal and dotted triangles, respectively. The white circles represent device-independent values of the phantom color patches captured by the scanner. The black circles represent sRGB colors rendered by using absolute colorimetric intent, where the scanner colors outside the sRGB gamut colors clipped. The length of the black line joining the black and white circles represents the color difference in terms of DeltaE between the two colors. 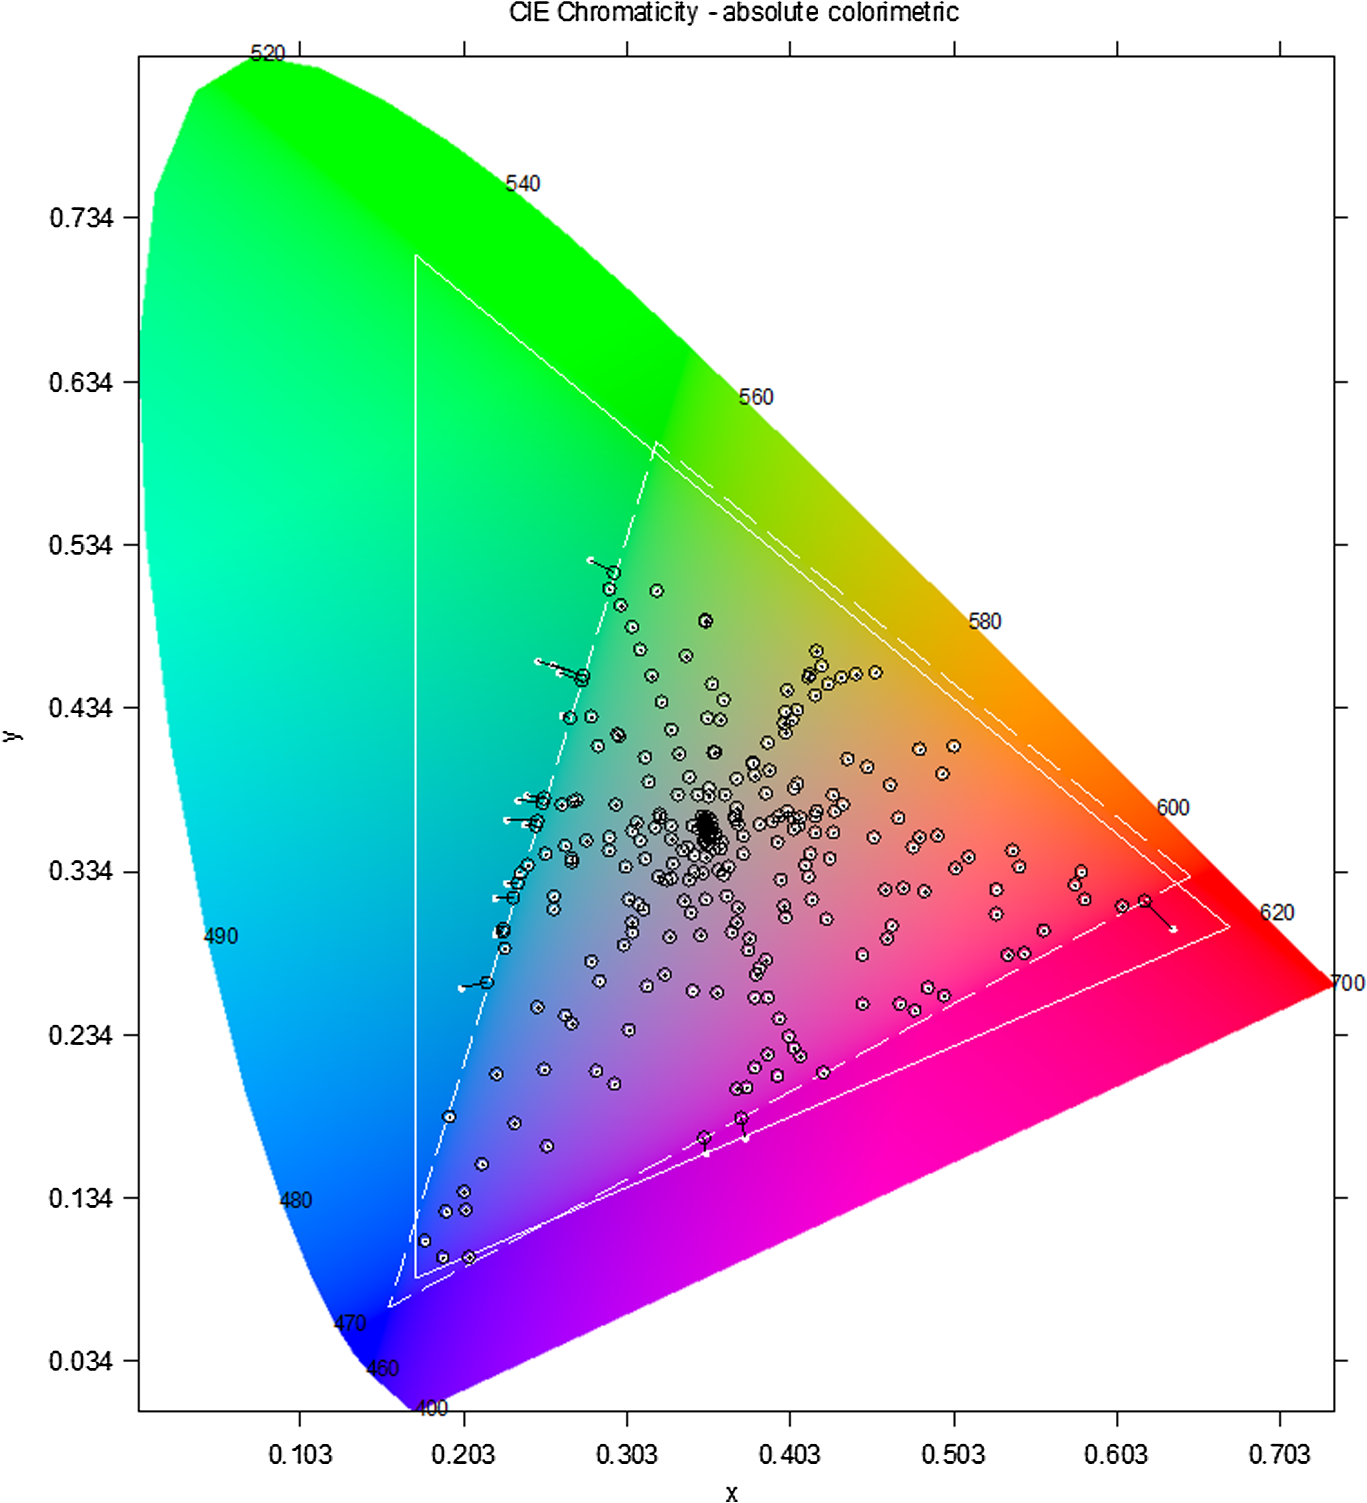 3.3.Scanner Color AccuracyThe color accuracy of a scanner is measured by comparing device-independent phantom colors reproduced by a scanner against the reference colorimetric values, as shown in Fig. 7. Figure 8 visualizes the DeltaE between the reference colors and the colors produced by a typical UFS. The figure shows 22 patches of , 201 patches of , 32 patches of , and 9 patches of , while the maximum and mean DeltaE values are 16.62 and 3.69, respectively. The relatively large DeltaE values, located in the dark color patches, are caused by sensor noises in the absence of adequate light. These patches show a large deviation in terms of DeltaE values across the scanners. Fig. 7Color accuracy test of a UFS. The scanner color calibration information is derived, as described in Fig. 1.  Fig. 8DeltaE between color reproduced by a typical calibrated UFS and reference colorimetric values on a phantom slide, represented by the height of the bars. The reference and UFS colors of the patches are shown in the left and the right triangles, respectively, located at the top of the bars.  The color accuracy test of 35 UFSs involved 9240 () comparisons. Compared to the uncalibrated UFSs where only three patches resulted in , the calibrated scanners resulted in 695 (7.5%) patches with a . The mean DeltaE across the patches per scanner is found to be in uncalibrated scanners, and in calibrated scanners. Figure 9 shows the means and standard deviations in DeltaE between the UFSs and reference colors across the patches. The mean DeltaE values across the scanners are not significantly different, and are mainly influenced by the stochastic noise behavior in dark patches. 3.4.Inter-scanner Color ReproducibilityThe inter-scanner color reproducibility is measured by comparing device-independent colors of the phantom slide produced by calibrated scanners with that of a model scanner and with each other. The model scanner consists of representative device-independent colors of the phantom, computed by using a local search method such that the overall DeltaE between the model scanner colors and the 35 given scanners is minimum. In our test, the average color difference between the model scanner and the 35 UFSs is found to be 3.1 DeltaE. The color reproducibility test among the 35 UFSs involved 157080 () comparisons. The fraction of the patches with a value of less than or equal to 1 is 32.8% in uncalibrated scanners and 63.5% in calibrated scanners. Figure 10 shows the inter-scanner variation as a similarity matrix in terms of the mean DeltaE, computed across the patches, between pairs of calibrated scanners. The diagonal elements of the matrix are zero because a scanner is compared to itself. The mean and maximum DeltaE scanner pair is found to be and 3.5, respectively, in calibrated scanners; and and 4.7, respectively, in uncalibrated scanners. Fig. 10Illustration of inter-scanner variability, in terms of mean DeltaE between two calibrated scanner reproductions of phantom slides, visualized as a similarity matrix. The UFS IDs are given in the horizontal and vertical axes. The color bar shows the corresponding DeltaE values of the colors in the matrix.  Figure 5 shows an image segment of a slide scanned by two scanners and reproduced using different approaches in ICC profile generation and rendering intents. The images using matrix-only and absolute colorimetric rendering intents represent the reproducibility of our current system. 3.5.Phantom Color Slide ReproducibilityThe reproducibility of the phantom slides is measured by scanning the slides with calibrated UFSs and calculating the color differences among the scans. In our test with 14 phantom slides, the average DeltaE between all the slide pairs is found to be . In total, 84% of the patches are found to be below or equal to DeltaE 1. Figure 11 shows the inter-target variation as a similarity matrix in terms of mean DeltaE, computed across the patches between all the possible phantom pairs. The relatively high DeltaE values seen in slide numbers 4 and 12–14, shown in the figure, belong to the target films from different Kodak production batches. Fig. 11Illustration of inter-slide variability, in terms of mean DeltaE between two reproductions of phantom slides, visualized as a similarity matrix. The phantom slide IDs are given in the horizontal and vertical axes. The color bar shows the corresponding DeltaE values of the colors in the matrix. 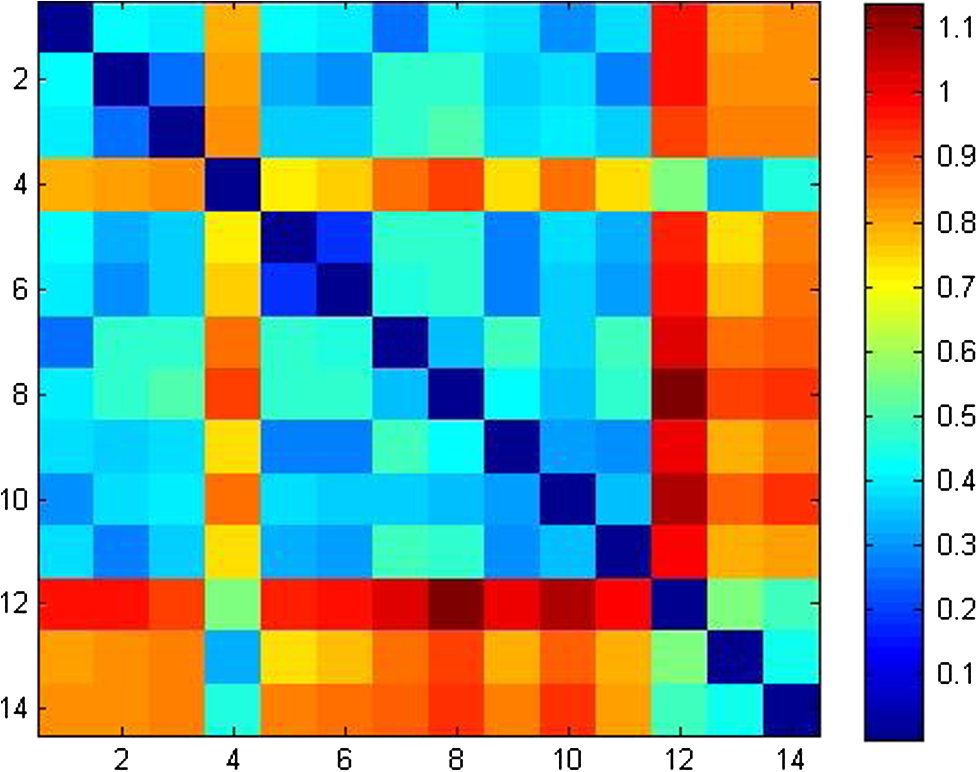 4.ConclusionWe presented a workflow for color reproduction in WSI scanners by calibrating the scanners using a color phantom. We evaluated the ICC compliant LUT-based, TRC-based, and matrix-only based calibration/profiling methods. When the phantom colors reproduced by the calibrated scanners using LUT-based, TRC-based, and matrix-only based methods were compared to the colorimetric values of the phantom patches, the resulting DeltaE values were 0.47, 2.94, and 3.64, respectively. The LUT-based method showed a better fit. However, when the method was applied in tissue scans, the colors reproduced by the LUT-based and TRC-matrix resulted in visually unnatural colors, which were also inconsistent among scanners. The lower quality of the reproduced colors in tissue slides, contrary to the phantom slides, upon using a nonlinear calibration method is caused by the overfitting and locally optimized parameters to the phantoms. The matrix-only method resulted in loose but globally fitting calibration parameters and the tissue images reproduced using the method appear to be visually natural and consistent among scanners. The absolute colorimetric rendering approach resulted in the most consistent color behavior in multiple scanners. Therefore, we recommend the matrix-only calibration/profiling and absolute colorimetric rendering intent for the WSI scanner calibration. The proposed workflow is applied and tested in 35 scanners. The average color accuracy, computed as a difference between scanner reproduced colors and the reference colorimetric values on phantom slide scans, is found to be 3.5 DeltaE in calibrated scanners, compared to 10.09 DeltaE in uncalibrated scanners. Similarly, the average difference between a representative scanner computed out of 35 scanners, called the model scanner, and the individual scanners is 3.1 DeltaE. The average difference among the scanner pairs is 1.17 DeltaE in the case of calibrated scanners and 1.8 DeltaE in the case of uncalibrated scanners. The improved color accuracy and reproducibility results in the calibrated scanners show the effectiveness of the proposed approach. The improvement is also visible in tissue images. We tested the proposed method of phantom slide preparation in 14 slides. The inter-slide difference of the phantom colors reproduced by calibrated scanners is 0.6 DeltaE on average and 84% of the patches have DeltaE values equal to or less than 1 DeltaE. The large DeltaE values are located in the dark color due to sensor noises in the absence of adequate light. Since the color behavior of the phantom images reproduced by the scanners is very similar, the phantom slides can be used interchangeably in color profiling or for assessing the scanners. The proposed scanner calibration using the phantom slides shows encouraging results in color reproduction; however, the color phantoms require to be improved to suit more in the context of pathology. The Kodak Q60 films used in the phantom slide are developed for natural scenes and skin tones. When the calibration is locally optimized, as in the case of LUT-based method, it becomes inapplicable to tissue slides due to (1) difference in the medium: tissue versus film and (2) difference in colors: pathology versus natural scenes. The next generation of phantom slides should address these discrepancies. We also suggest further improvement for the usage of phantom slide. The current calibration method uses all the patches of the phantom slide except for the face colors. The same patches are used also in evaluation. A better approach would be to use a set of color patches in calibration and another standard set or a separate target for evaluation. Similarly, the relevance of our DeltaE-based approach in determining color accuracy and reproducibility is yet to be established in the context of clinical applications. The DeltaE values can be used as thresholds in setting WSI color standards. ReferencesL. Pantanowitz,
“Digital images and the future of digital pathology,”
J. Pathol. Inform., 1 15
(2010). http://dx.doi.org/10.4103/2153-3539.68332 2229-5089 Google Scholar
E. A. Krupinskiet al.,
“Observer performance using virtual pathology slides: impact of lcd color reproduction accuracy,”
J. Digi. Imaging, 25
(6), 738
–743
(2012). http://dx.doi.org/10.1007/s10278-012-9479-1 0897-1889 Google Scholar
Y. Yagi,
“Color standardization and optimization in whole slide imaging,”
Diagn. Pathol., 6
(Suppl 1), S15
(2011). http://dx.doi.org/10.1186/1746-1596-6-S1-S15 DMPAES 1052-9551 Google Scholar
S. Taniet al.,
“Color standardization method and system for whole slide imaging based on spectral sensing,”
Anal. Cell. Pathol., 35
(2), 107
–115
(2012). http://dx.doi.org/10.3233/ACP-2011-0037 ACPAER 0921-8912 Google Scholar
Y. Murakamiet al.,
“Color correction in whole slide digital pathology,”
in Proc. Color and Imaging Conf.: Color Science and Engineering Systems, Technologies, and Applications,
253
–258
(2012). Google Scholar
W.-C. Chenget al.,
“Assessing color reproducibility of whole-slide imaging scanners,”
Proc. SPIE, 8676 86760O
(2013). http://dx.doi.org/10.1117/12.2007215 Google Scholar
“International Color Consortium,”
(2014) http://www.color.org/index.xalter July ). 2014). Google Scholar
“ITU-R BT.709,”
Google Scholar
“International Comission on Illumination,”
(2014) http://cie.co.at/ July ). 2014). Google Scholar
“Kodak q-60 color input targets: Technical data Color paper June 2003,”
(2014) ftp://ftp.kodak.com/gastds/q60data/TECHINFO.pdf July ). 2014). Google Scholar
G. SharmaW. WuE. N. Dalal,
“The CIEDE2000 color-difference formula: implementation notes, supplementary test data, and mathematical observations,”
Col. Res. Appl., 30
(1), 21
–30
(2005). http://dx.doi.org/10.1002/(ISSN)1520-6378 CREADU 0361-2317 Google Scholar
M. R. LuoG. CuiB. Rigg,
“The development of the CIE 2000 colour-difference formula: CIEDE2000,”
Col. Res. Appl., 26
(5), 340
–350
(2001). http://dx.doi.org/10.1002/(ISSN)1520-6378 CREADU 0361-2317 Google Scholar
“Argyll Color Management System,”
(2014) http://www.argyllcms.com/ July ). 2014). Google Scholar
G. SharmaP. D. Fleming,
“Evaluating the quality of commercial ICC color management software,”
in Proc. WMU ICC Profiling Review 1.1, TAGA Technical Conference,
(2002). Google Scholar
BiographyPrarthana Shrestha received her MSc and PhD degrees in computer engineering from Technical University of Eindhoven (2009) and industrial design from Technical University of Delft (2002), respectively. Currently, she is working as a senior scientist at Philips Digital Pathology Solutions, Best, The Netherlands. Her focus is on the research and development of devices and algorithms in the domain of digital pathology. Bas Hulsken received his MSc degrees in physics and natural sciences in 2001 from the University of Nijmegen. He obtained his PhD degree in physics and chemistry of catalytic surfaces using liquid-cell scanning tunneling microscopy from the University of Nijmegen. In 2006, he joined Philips corporate research to work on novel microscopy applications for healthcare. Currently, he is the technology director of Philips Digital Pathology Solutions. |