|
|
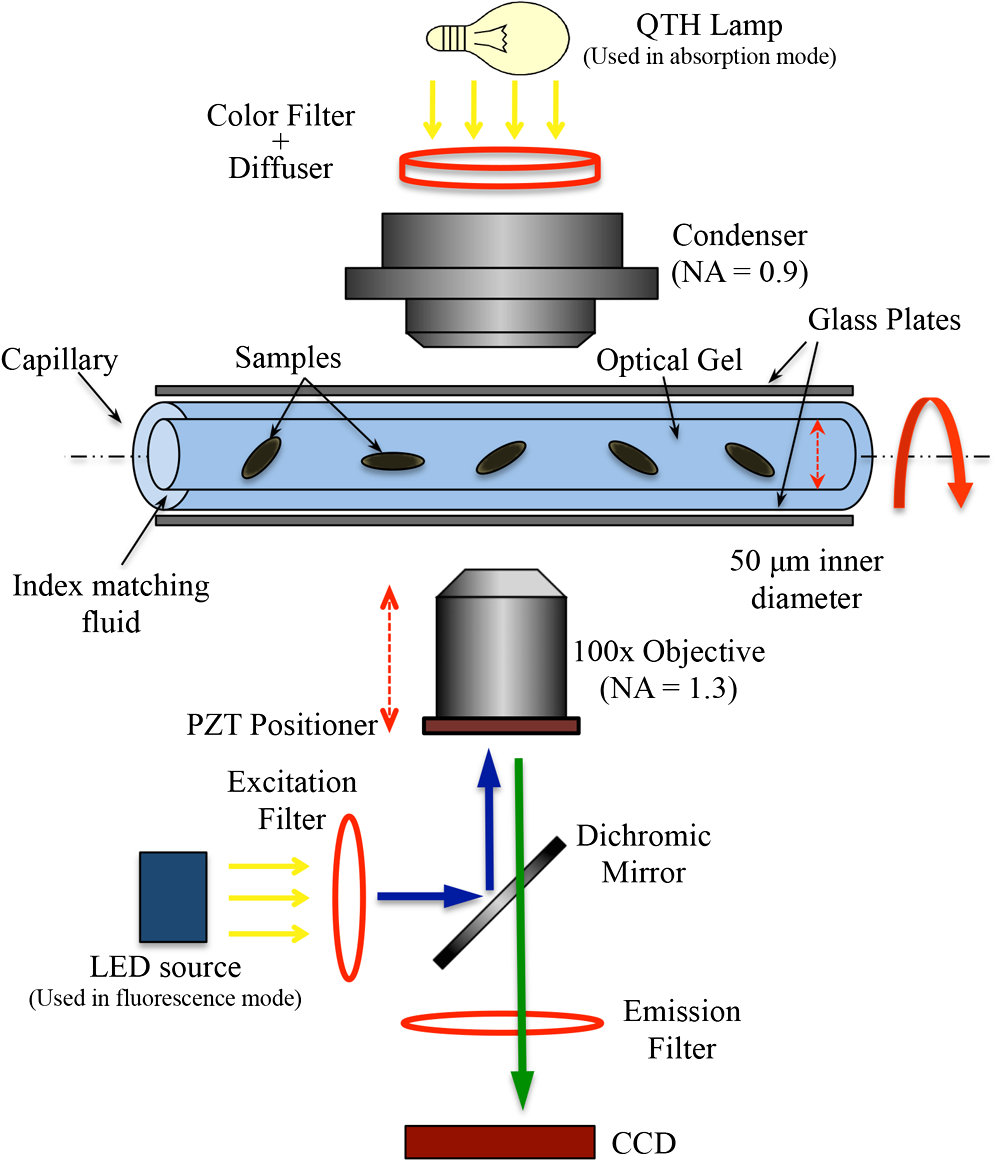
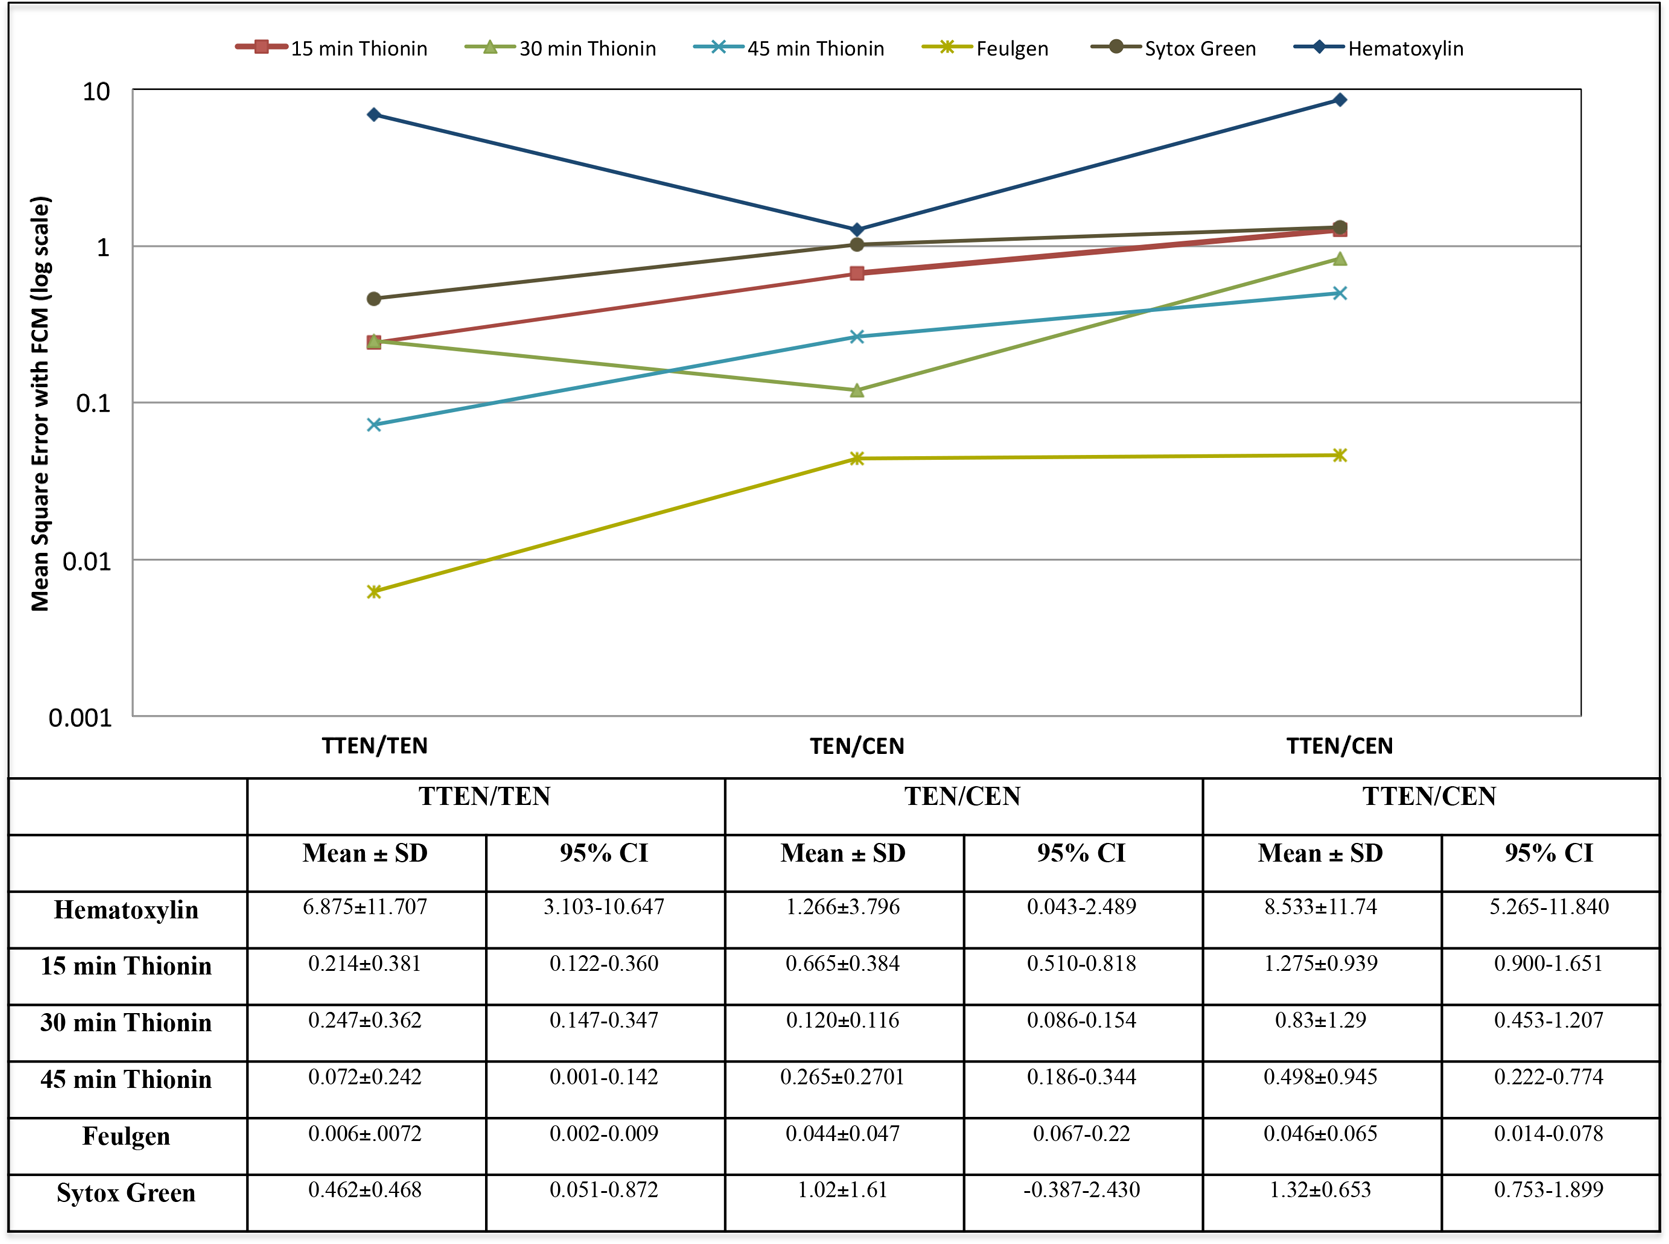
1.IntroductionOne of the most crucial factors for high cancer mortality is lack of efficient methods for early diagnosis. Conventionally, diagnosis is made by taking biopsies from the involved organ and having prepared tissue or cells examined by a pathologist or cytopathologist under bright field microscopy. Malignancy associated changes in morphology or biomarkers are used to distinguish a cancer cell from a normal cell.1 One such biomarker, which has been extensively studied in the past for early diagnosis of cancer, is aneuploidy, an abnormal DNA content.2–10 Various attempts have been made to automate this diagnostic process of nuclear DNA content assessment using computer-aided analysis of two-dimensional (2-D) slides.9–11 Currently, the two most common techniques used to quantify DNA content are flow cytometry (FCM) and 2-D image cytometry (ICM). In FCM, the sample is stained with a DNA specific fluorophore [usually diamidino-2-phenylindole (DAPI)]; the cells rapidly flow one-by-one across the focused laser beam and the intensities of the fluorescences emitted are used to quantify the DNA content. On the other hand, ICM uses an absorptive stain (usually Feulgen), which binds to the DNA stoichiometrically and 2-D optical transmission images are acquired.5,12–14 After nuclear segmentation is done on ICM images, calculation of its integrated optical density (IOD) provides the total nuclear DNA content of the cell. Both techniques have their advantages and limitations. FCM is rapid with high throughput, but has no visual distinction between a cancer cell and a normal cell. It needs a large sample size, which is often difficult to obtain, and cannot distinguish aneuploidy in single cells in spite of measuring DNA content per cell, because the measurement is a distribution of DNA content (histogram) for the entire population of cells. Thus, small tumors can be masked by the presence of nontumor, inflammatory or normal diploid populations.12,15,16 On the other hand, ICM, though ideal for small size populations, is time consuming.12,15 It provides visual morphological distinction between a cancer cell and a normal cell, a very important attribute for cytopathologists. Since it looks at individual cells, ICM can identify occasional abnormal cells in the sample. However, in ICM, despite the wide acceptance of Feulgen technique, there are several disadvantages, such as the procedure is complicated and time consuming.17–19 Further, once the sample is stained with Feulgen, restaining with other stains is not feasible, which is often required by cytopathologists for additional characterization. Also, finding every rare cell and segmenting it out in ICM is very difficult due to overlapping and fragmentation.15 Finally, only 2-D images are used for analysis, whereas the cells and their nuclear chromatin features are all three-dimensional (3-D). Hence, an analysis using Feulgen technique on traditional ICM may not be the best approach to give accurate results for early cancer diagnosis. Recently, techniques for obtaining 3-D information about biological samples have been developed.20–23 However, all are limited to either analyzing tissue samples or analyzing confocal images using fluorescent dyes, making them unsuitable for current needs of cytopathologists who rely on absorption-based stains.24 Based on over 100 years of absorption imaging correlation with clinical outcomes, cytopathologists have built a knowledge base for disease diagnosis. Absorption measurement is the corner stone of clinical cytopathology and, thus, a need for isotropic, high-resolution, quantitative 3-D imaging using absorption staining is significant. Although cytopathologists have a foundation of knowledge with absorption stains, future inclusion of fluorescence imaging using biomarkers could further assist in disease diagnosis and personalized treatment selection. In the present study, we used 3-D optical projection tomographic microscopy (OPTM) along with an automated method for 3-D nuclear segmentation to compute the DNA content on a cell-to-cell basis using different absorption and fluorescence stains for early cancer diagnosis. OPTM generates 3-D, submicron, isometric, and high-resolution images of nuclear features.25 Since the entire volume of the nucleus is measured, there is less uncertainty in the measure of total DNA content as every voxel is used to calculate the integrated optical density. Variations in perspective of the nucleus from 2-D images are eliminated in a single OPTM image. In addition, OPTM can perform multimodal imaging,26 generating both bright field transmission image as well as a fluorescence image with exact co-registration. OPTM combines attributes of computed tomography (CT) imaging with slow FCM. Thus, it provides quantitative cytometry along with 3-D visualization of morphology. It had also been shown that as compared to 2-D images, OPTM-captured 3-D images of single cells result in threefold reduction in false negative rates for adenocarcinoma detection without affecting its high specificity of 96%.27 Hence, quantitative 3-D imaging on single cells using OPTM is expected to provide more accurate and robust results compared to ICM. Based on the combined improvements in sample preparation, OPTM imaging, and computational processing, we present a novel procedure for quantification of DNA index (D.I), which is defined as the ratio of the mean DNA content of the Go/G1 sample peak divided by the mean DNA content of normal diploid Go/G1 human cell peak. Chicken erythrocyte nuclei (CEN), diploid trout erythrocyte nuclei (TEN), and triploid trout erythrocyte nuclei (TTEN) were used as internal biological standards along with lymphocytes as specimens for this study. These standards have a known DNA content and are typically used for calibrating flow cytometers.28–31 They are used in this study to calibrate OPTM. In order to find an alternative stain to Feulgen, which provides stoichiometry as well as visual morphology in 3-D, we stoichiometrically optimized acidic thionin stain using different staining times. Acidic thionin stain was chosen as it has been shown to be stoichiometric as well as provide visual morphology in 2-D.17,32–34 Ratios of integrated optical densities from OPTM were compared with ratios of DNA indices from FCM. FCM was considered as the reference for stoichiometry as it is a well-established technique for DNA determination and also analyzes cells in 3-D. A similar comparison was also done using two other absorption-based stains (hematoxylin and Feulgen), and one fluorescent stain (SYTOX green). Variances of all the stains were measured and compared to each other. Retention of morphological features using these stains was conducted with these standards and seven cancer cell lines from culture. Morphology was visually compared for all the stains with assistance from an experienced cytotechnician. 2.Materials and Methods2.1.Sample PreparationCEN, TEN, and TTEN (Biosure Inc., Grass Valley, California) were used as internal standards to calibrate OPTM. Human lymphocytes (HemaCare Corporation, Van Nuys, California) were used to calculate the D.I of each internal standard using FCM. Cultured human cancer cell lines of A549 (lung adenocarcinoma), BT-474 (breast carcinoma), CacO-2 (colorectal adenocarcinoma), Hep G2 (liver carcinoma), HT-29 (colorectal adenocarcinoma), PC3 (prostate carcinoma), and SK-BR-3 (breast adenocarcinoma) were used to assess the retention of morphological features. All cell lines were acquired from American Type Culture Collection, Manassas, Virginia. 2.2.Flow CytometryStandard FCM was performed on all the three samples and lymphocytes, which were fixed in 50% ethanol according to the conventional protocol and the manufacturer’s instruction.35 Each sample was resuspended in an isotonic pH 7.4-buffered solution with 0.1% nonidet P-40 detergent, DAPI, and 1% RNAse, triturated with a 26-gauge needle, and filtered through 40-μm steel mesh. The analysis was performed using an InFlux cytometer (BD Biosciences) with UV excitation. A total of 20,000 cells were analyzed, and in all cases, a coefficient of variation (CV) was found. D.I and S-phase fraction (SPF) were analyzed for each internal standard in comparison with lymphocytes using the software program MultiCycle36 (Phoenix Flow Systems, San Diego, California). 2.3.Image CytometryHematoxylin, thionin, Feulgen, and SYTOX green were used on equal volumes of CEN, TEN, and TTEN for quantitative analysis of DNA content. Thionin stain was optimized for stoichiometry by varying the staining time periods. To avoid batch-to-batch variations, thionin stain was prepared in the laboratory, while Feulgen, hematoxylin, and SYTOX green were preordered. 2.3.1.StainingThionin stainingThionin stain was prepared using protocol from a previously published study.37 500 μL of each standard was fixed with 50% ethanol and then stained with acidic thionin for 15, 30, and 45 min using the suspension technique. In this technique, we took 500 μL of the sample and centrifuged it at 500 g for 5 min. We aspirated out the supernatant, leaving the sample behind. To this, we added 200 μL of thionin stain and waited for 10, 25, and 40 min. before it was centrifuged at 500 g for 5 min; hence, the total staining time achieved was 15, 30, and 45 min., respectively. After that, we washed it with gradations of ethanol (50 to 100%) and later with xylene twice before inserting it into syringes with optical gel. Hematoxylin stainingSimilarly, for hematoxylin, 500 μL of the sample fixed in 50% ethanol was taken and centrifuged at 500 g for 5 min. We aspirated out the supernatant, leaving behind the sample. To this, we added filtered tap water to make the volume 100 μL and then added 25 μL of 0.22 μm syringe-filtered Gill’s hematoxylin solution #1 (Electron microscopy sciences, Hatfield, Philadelphia). We centrifuged it immediately at 500 g for 5 min. and later aspirated out the supernatant. The excess stain was washed out with two washes of filtered tap water. Then the sample was dehydrated with gradations of ethanol (50 to 100%) and later washed twice with xylene before inserting into the syringe with the optical gel. Feulgen stainingThe Feulgen staining technique was performed following a well-established protocol.38–41 500 μL of the sample, which had been fixed with Bohm’s fixative, was centrifuged at 500 g for 5 min. and the supernatant was aspirated out leaving behind the sample. This was followed by washing the sample with distilled water and hydrolyzing it using 5 M HCl at 22°C for 40 min. Thereafter, excess HCl was washed using distilled water and later the sample was stained with Schiff reagent solution (Fisher Scientific, Waltham, Massachusetts) for 45 min. The sample was then washed with sodium bisulphite solution and distilled water. Later, it was dehydrated with gradations of alcohol (50 to 100%) and washed twice with xylene before inserting it into the syringe with the optical gel. SYTOX green stainingA protocol similar to the one used for hematoxylin was followed. Samples, which were fixed in 50% ethanol, were washed with filtered tap water before staining with SYTOX green solution (1:5000 dilution from stock, Invitrogen, Carlsbad, California) for 10 min. We centrifuged it at 500 g for 5 min and later aspirated out the supernatant. Then the sample was dehydrated with gradations of ethanol (50 to 100%) and later washed twice with xylene before inserting into the syringe with the optical gel. 2.3.2.Instrument construction and image acquisitionFigure 1 shows a schematic diagram of the optical projection tomography microscope. The system was built on a wide-field optical microscope (Olympus IX71) with a custom-designed microcapillary-based rotation stage.25 Since OPTM can do multimodal imaging, both absorption as well as fluorescence imaging were performed on the same instrument.26 For absorption imaging, the light from the halogen lamp (QTH) is filtered by a diffuser and a color filter. The filters were chosen so as to match the spectral properties of the absorptive dyes, and for thionin/hematoxylin and Feulgen, respectively.42,43 From the filter, light passes through a 0.9 numerical aperture (NA) condenser, which focuses the light onto the sample, collected by the objective lens and sensed by the monochromatic CCD camera (Prosilica GE1650, , 7.4 μm pixel size). On the other hand, for fluorescence imaging, an epi-fluorescence setup was used, in which light from the light-emitting diodes (pE100, CoolLED, River Way, Andover, United Kingdom) was filtered by an excitation filter and then reflected to an objective lens by a dichromic mirror. Fluorescence signals from the sample were collected by the same objective lens, passed through the dichromic mirror, and were then filtered by an emission filter before reaching the camera. Spectral properties of the fluorescent dye were matched with both the excitation and the emission filter. The sample is flown through a 50-micron inner diameter capillary tube. The tube rotates in an oil-filled space between two flat, parallel glass slides. The optical gel (Nye SmartGel OC431A-LVP, Fairhaven, Massachusetts) in which the sample is immersed and the oil maintain a constant refractive index both inside and outside the capillary, thereby minimizing the optical distortion caused by the curvature of the tube. A pseudo-projection image is taken by axially scanning the objective focal plane through the sample and optically integrating all the focal plane images using a high-NA objective (NA 1.3, ), which is mounted on a piezoelectric positioner (NV40/1CL, Piezosystem Jena, Jena, Germany) focused to the CCD camera. The axial scanning range is adjusted for different samples in order to cover the entire sample. Five hundred such pseudo-projection images were taken in one rotation by rotating the capillary tube at uniform angular intervals of 0.72 deg. The specimen location inside the tube was also tracked so that accurate focal plane scanning could be accomplished during tube rotation. To avoid misalignment of these pseudo-projections due to vibrations, the center of mass of each pseudo-projection image was computed and aligned to correct for registration errors. After these pseudo-projections were aligned, a filtered backprojection algorithm44 was applied to these 500 pseudo-projections to create a 3-D image of the specimen with an isometric resolution of 0.35 microns.26 2.3.3.Image analysisAutomated 3-D segmentationThe 3-D reconstructed images from OPTM were segmented using a gradient-based approach45 in which a single 3-D optical microscope cell image is modeled as an object with three distinct intensity values: a low-intensity background, an intermediate-intensity cytoplasm, and a much higher-intensity nucleus. Thus, going from the background to the center of the cell, two rapid intensity transitions are expected: once for the background-cytoplasm boundary and once for the cytoplasm-nucleus boundary [Fig. 2(c)]. However, in our case, since we have only nuclei, going from background to center only one rapid intensity transition is expected: background-nucleus boundary [Fig. 3(c)]. Fig. 2(a) Central slice of HT-29 cancer cell (human colorectal adenocarcinoma). (b) Gradient image of the central slice. (c) Segmentation using gradient-based approach of central slice showing the two boundaries (red for nucleus, green for cytoplasm, and black for background).  Fig. 3Three-dimensional (3-D) segmentation of triploid trout erythrocyte nuclei (TTEN) stained with 45 min acidic thionin stain. (a) Central slice of TTEN nucleus image. (b) Gradient image of the central slice. (c) The computed region boundary superimposed on the central slice. (d) Histogram of the central slice. (e) Gradient figure of merit graph for all possible threshold values depicting the two local maximas (only the first local maxima was used to determine the threshold for nuclear segmentation). 3-D surface rendering of (f) axial, (g) sagittal, and (h) coronal views of TTEN nuclear region computed by applying automatically determined threshold to the whole 3-D image (blue for residual stain and yellow for nucleus). 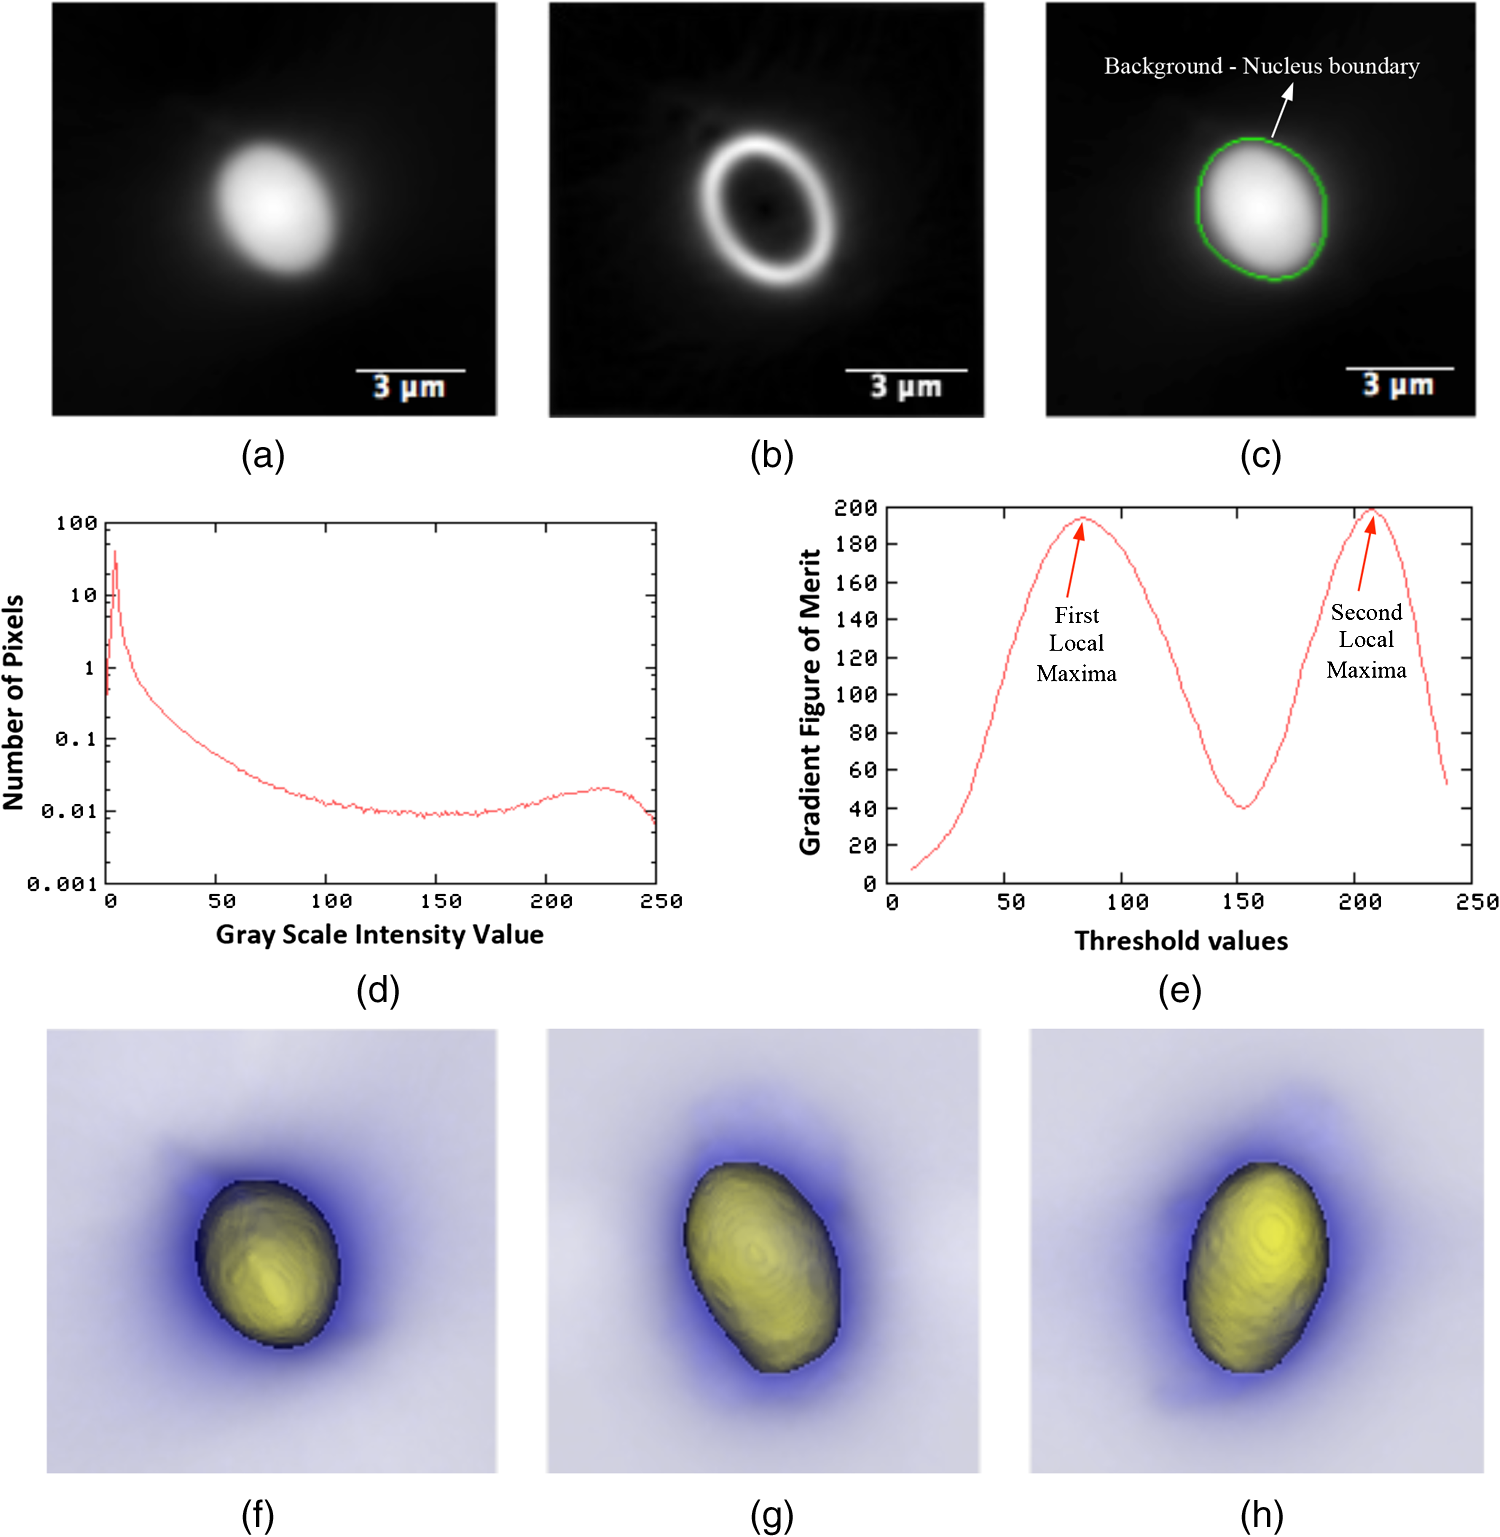 The automated gradient-based segmentation algorithm performed at Cornell University (Ithaca, New York) is based on the concept that pixel intensities in 3-D cell or nuclei image should map well to the optical absorption values as they do with convectional x-ray CT. For this condition, a single global threshold should be sufficient for a good accurate segmentation. Further, the boundary pixels of the regions selected by the optimal threshold should all have a high gradient value (since they are in the transition region between outside and within the segmented object). In our gradient-based algorithm, a gradient figure of merit is computed for each possible threshold value. This figure of merit is the average gradient level for the boundary pixels selected by the threshold. It should have a maximum value when the threshold selects pixels in the transition between two regions of different intensities. A figure of merit curve containing gradient information is computed based on the center axial slice of a TTEN stained with 45 min thionin stain using the following algorithm (Fig. 3). The gradient segmentation algorithm: (1) A gradient image of the central slice was computed using Deriche gradient operator.46,47 (2) A gradient figure of merit value was computed for each possible image threshold value, which is nothing but the mean gradient value selected by the border pixels. (3) The gradient figure of merit values were then plotted against all possible threshold values. Typically for a cell, the first two local maxima’s of the graph correspond to the global thresholds for background-cytoplasm and for cytoplasm-nucleus segmentation, respectively. However, for these nuclei, since these do not have cytoplasm, only the first local maximum was considered for background-nucleus segmentation. Figure 3 shows the original intensity image of central slice, the gradient image, and the final segmentation result of a TTEN stained with 45 min thionin stain. Two significant peaks were observed in the gradient figure of merit plot [Fig. 3(e)]. However, only the first local maximum was used to compute the threshold for background-nucleus segmentation, though there were no visible features in the histogram relating to that value. The second local maximum corresponded to features within the nucleus. Surface rendering of the whole segmented nucleus is also shown for three orthogonal viewing directions [Figs. 3(f) to 3(h)]. The blue color represents the residual staining of the 45 min thionin stain, while yellow represents the nucleus. Similar analysis was done using other nuclear stains. Figure 4 shows the axial view of 3-D surface rendering of TEN when stained with these nuclear stains. Comparison of image cytometry analysis with flow cytometry analysisUsing the gradient-based segmentation algorithm with implementation in the VisionX/SIMBA environment,48 3-D segmentation of 50 images of CEN, TEN, and TTEN for each staining procedure (hematoxylin, 15 min thionin, 30 min thionin, 45 min thionin, Feulgen, and SYTOX green) was achieved. The camera sensor was assumed to be linear and uniform illumination was maintained. All samples were fixed, stained, and imaged under constant conditions to allow a direct comparison of the measured data. For each nucleus, intensities of all the pixels in the segmented nuclear region of all slices were added to obtain the IOD of the 3-D nucleus. Assuming the stains to be stoichiometric to DNA, the IOD of the 3-D nucleus should be proportional to the amount of DNA content in that nucleus. Thus, the ratios of the IOD between the three nuclei for all the stains gave us the corresponding ratios of their DNA content. For each ratio, the mean and the standard deviation of the ratio of individual observations were computed using STATA 12. Later, for stoichiometry, these ratios were compared with the ratio of D.Is obtained from FCM. SPF was not used for comparison as these nuclei are standards having very low SPF values, which was reconfirmed with FCM. The variances of all the stains were compared with each other. Also, morphology was visually compared among all the stains. 2.4.Statistical AnalysisAll statistical analysis was performed using either MATLAB® (MathWorks, Version R2012a, Natick, Massachusetts) or Stata (StataCorp LP, Version 12.0, College Station, Texas). The variances of all the four stains were analyzed using a modified right tail test after Bonferroni correction.49,50 For analyzing stoichiometry, the mean square error (MSE) between the ratios of each individual observation and that obtained from FCM was compared for all the stains. 3.ResultsThe mean and the standard deviation of 50 ratios of individual observations for different stains using OPTM along with ratios of D.Is obtained from FCM are shown in Fig. 5. Feulgen was the most stoichiometric stain among hematoxylin, thionin (45 min), and SYTOX green (Fig. 5). Fig. 5The mean and the standard deviation of 50 ratios of individual observations for hematoxylin, SYTOX green, thionin (45 min), and Feulgen along with ratios of DNA indices obtained from flow cytometry. 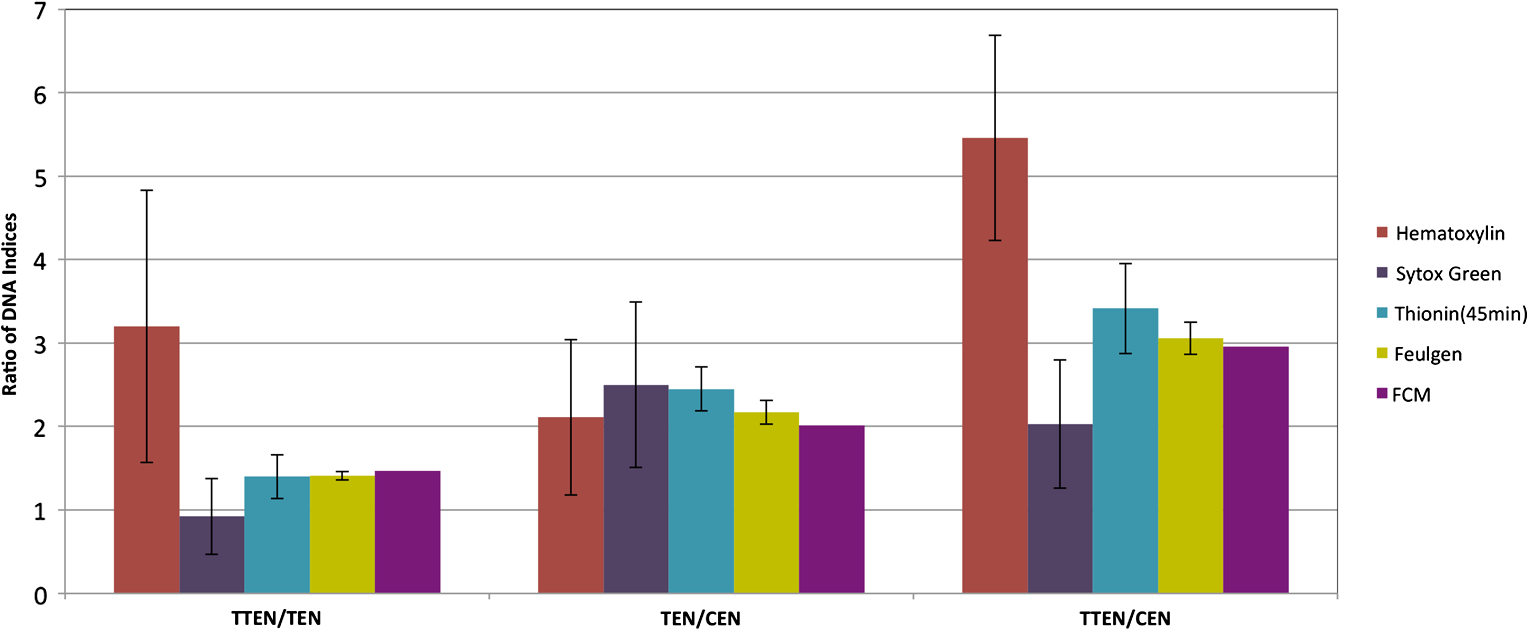 3.1.StoichiometryThe MSE of TTEN/TEN, TEN/CEN, and TTEN/CEN were highest with hematoxylin staining and least with Feulgen staining. Among different thionin staining times, 45 min thionin had the least MSE, while 15 min thionin had the highest. SYTOX green MSE was greater than both thionin and Feulgen staining but less than hematoxylin as shown in Fig. 6. 3.2.VarianceThe variance of hematoxylin staining was statistically greater than 45 min thionin as well as Feulgen staining for all the three ratios. The variance of 45 min thionin was also statistically greater than Feulgen staining for all the three ratios. The variance of SYTOX green was statistically greater than Feulgen staining but not statistically greater than 45 min thionin for all the three ratios as shown in Table 1. The variance of SYTOX green and hematoxylin were statistically not significant () when compared using a two-tail paired test. Table 1Results of a right tail F test (followed by Bonferroni correction in p value) between variances of different stains.
Note: TTEN, triploid trout erythrocyte nuclei; CEN, chicken erythrocyte nuclei, 4.DiscussionEarly diagnosis, preceding the clinical signs of cancer, is expected to have a significant impact on reducing cancer-related mortality. Further, it has been confirmed that chromosomal aneuploidy is an early key event in tumor genesis caused by genetic instability.7 Hence, stoichiometric DNA ICM has expected importance for early diagnosis. We have combined some of the benefits of both FCM and ICM by developing a technique where we can analyze the DNA content of a cell in 3-D without appearing to compromise the nuclear morphology of the cell. This required two steps: an initial staining of the cell by a stoichiometric stain followed by 3-D imaging of the stained cell. We have demonstrated not only quantitative DNA staining, but also the automated measure of nuclear volume from 3-D images. Feulgen technique, the gold standard for stoichiometry in 2-D,51–53 showed the best results in 3-D as determined by the highest accuracy (least MSE) to FCM and least measurement variance. We optimized the staining time of acidic thionin for stoichiometry and have shown that 30 to 45 min of staining time is the next best stain for stoichiometry. As expected, it outperformed hematoxylin, the most common stain used in cytology.17,34 However, nuclear morphology did not appear to be preserved for 30 to 45 min of thionin staining time, making it less suitable for quantitative DNA analysis. Both hematoxylin and Feulgen preserved nuclear morphology and, hence, Feulgen technique can be considered as the overall gold standard for quantitative DNA analysis in 3-D as well. The MSE of TEN/CEN in Fig. 6 was slightly more for 45 min thionin than 30 min thionin, possibly because male CEN tend to have a higher DNA content than female CEN.54,55 Both male and female trout erythrocytes have almost the same size of sex chromosomes and, hence, the DNA variations due to sex-related changes could be ignored for them.55 And since we had used mixed populations of both CEN and TEN, this could have led to an increase in the ratios of D.Is when CEN was present in the ratios. Unlike FCM or ICM, OPTM provides 3-D morphometric data like volume, shape, and nuclear texture, which is very important for cytopathologists who primarily rely on morphology of the cell for cancer diagnosis. Like 2-D ICM, hematoxylin stain visually enhances nuclear morphology, but showed high variance and least stoichiometricity in 3-D. Consequently, after having been used in diagnostic cytology for more than a century, batch-to-batch variation, nonspecific binding to the nucleus, and cytoplasmic regions make it inapt for quantitative assessment of DNA.17,34 On the other hand, Feulgen staining, such as in 2-D, is highly stoichiometric, showed the least amount of variance, and appeared to preserve nuclear morphology in 3-D as well (Fig. 7). SYTOX green was neither stoichiometric nor preserved nuclear morphology. As shown in Fig. 4, residual cytoplasmic staining was observed for all the absorption stains. However, as compared to other absorption stains, it was reduced for Feulgen staining. SYTOX green showed no residual cytoplasmic staining [Fig. 4(f)]. As an alternate stain to Feulgen, 30 to 45 min thionin showed the least variance and maximum stoichiometry among all the absorption stains. However, nuclear morphology was not well preserved, possibly because of high staining time, which might have caused overstaining and nonspecific binding. Fig. 7Two-dimensional (2-D) images of (a) axial, (b) sagittal, and (c) coronal views of an A549 cell (human lung adenocarcinoma) stained with Feulgen technique. 2-D images of axial views of (d) CacO2 cell (human colorectal adenocarcinoma), (e) Hep G2 cell (human liver carcinoma), (f) HT-29 cell (human colorectal adenocarcinoma), (g) PC3 cell (human prostate carcinoma), (h) SK-BR-3 cell (human breast adenocarcinoma), and (i) BT-474 cell (human breast carcinoma) stained with Feulgen technique. The images show dense nuclear DNA staining along with light residual cytoplasmic staining. All the above cells show heterogeneous chromatin content, a typical characteristic of cancer cells.  During morphological assessment, the cytopathologist found the general features observed in the nuclei of human cancer cells fairly obvious when they were stained with Feulgen (Fig. 7) and hematoxylin staining: highly variable nuclear size and shape, lack of uniformity of internal structures, general disorganization of chromatin particles, and distribution of those particles within the nuclear membrane. Chromatin particles were most often irregular in size and distributed within the nuclei of adenocarcinoma. However, in squamous carcinomas, extreme variation in overall nuclear size and bizarre cell/nuclear shape might be observed, especially for tumor cells derived from keratinizing lesions. None of the above features were clearly visible when the same cancer cells from culture were stained with other absorption and fluorescence stains. Although this qualitative analysis shows that nuclear morphology is preserved only for Feulgen and hematoxylin staining, additional work is needed for a more quantitative assessment using computerized morphometric analysis.56 A major advantage of OPTM is that single cell images are acquired with equal resolution in all directions for accurate 3-D image analysis. This makes 3-D segmentation straightforward and robust for single cell analysis. In this study with bare nucleus standards, there were no problems with cell aggregation and no complications from fragmentation or overlapping of cells. Additional work is needed to assess the 3-D segmentation algorithm on clinical specimens and mixtures of cells in which aggregation and complex nuclear morphology may be expected (Fig. 7). Further, the 3-D information provided by the OPTM comes with a cost; the acquisition of 3-D images is currently at very low throughput. Engineering higher throughput with improved image quality is a major challenge in the future.57 Though there are techniques that perform high-throughput image cytometry, like ImageStream58 and STEAM flow analyzer,59 they only analyze cells in a single perspective. The 3-D ICM system being developed as Cell-CT™60 images single cells from 360 deg, which has recently been shown to make diagnosis of lung cancer highly accurate in sputum specimens, most likely by enriching lung epithelial cells. A more accurate but slower diagnostic system of 3-D image based morphology and D.I cytometry can be a cost-effective red-flagging triage for subsequent CT-scanning follow-up. To our knowledge, this is the first study that has quantitatively measured DNA content in 3-D using absorption stains. A previous study compared nuclear absorbance stains for stoichiometry from 2-D images. In an attempt to standardize Papanicolaou stain, Schulte and Wittekind17 compared cervical smears with acidic thionin, hematoxylin, and Feulgen staining and found that both thionin and Feulgen were more reproducible and stoichiometric than hematoxylin. There are also a couple of studies for quantification of DNA content in 3-D with fluorescence dyes. Irinopoulou et al.61 and Rigaut et al.62 used chromomycin to analyze DNA content in cancer tissues using confocal laser scanning microscopy. Further, they only used a fixed threshold for 3-D segmentation of the nucleus as compared to a more adaptive approach, which we have used. However, photo-bleaching, overlapping excitation, and emission spectra of the stain, low signal-to-noise ratio all make fluorescence imaging less reliable for quantitative image analysis compared to absorbance imaging, which our study also shows.63 More work has to be put into making OPTM quantitative for DNA content using fluorescent dyes. Nonetheless, in its current state, it can be used to detect various fluorochrome-labeled biomarkers for diagnosis of diseases, including cancer. Currently, we are validating our approach for quantification of D.I and SPF with FCM using different cancer cell lines. Our technique has the potential for detecting cancer accurately in small populations of cells like lung cancer through induced sputum samples.60,64 For example, an enriched sputum sample from a lung cancer patient would mostly contain respiratory epithelial cells having very few cancer cells.65 Samples such as these, if stained with Feulgen technique and passed through an OPTM at high sensitivity and specificity, would show positive results for cancer using aneuploidy as an additional feature within a classifier. In addition to aneuploidy, OPTM is classically trained for 3-D morphological features, such as abnormal nuclear-to-cytoplasmic ratio and chromatin textures, to make the overall detection of cancer highly accurate and robust.27,66 5.ConclusionTo conclude, OPTM successfully extends the current cytopathological techniques from 2-D to 3-D using both absorption and fluorescence staining. In extending DNA ICM from 2-D to 3-D, Feulgen staining technique still remains the gold standard compared to thionin, hematoxylin, and SYTOX green. The 3-D images of nuclei with Feulgen staining along with the automated algorithm of 3-D nuclear segmentation demonstrated the ability to accurately measure DNA content concurrently with conventional morphological techniques extended to 3-D. AcknowledgmentsTechnical support and training were gratefully provided by Sarah Shimer, Ben Hawthorne, Ryland Bryant, Mathew Watson, Christy Lancaster, David Steinhauer, and Jon Hayenga of VisionGate Inc., R&D center in Seattle. SYTOX green fluorescence data were provided by Qin Miao of Department of Bioengineering at University of Washington-Seattle. We would also like to thank Charles Mahan, Kelly Hudkins, Donna Prunkard, and Peter Rabinovitch of Department of Pathology at University of Washington-Seattle for helping with the staining and flow cytometry. Cell-CT is a registered trademark of VisionGate Inc. Funding for this Interdisciplinary and Collaborative NSF project was provided by National Science Foundation, Grant # CBET-1014976 & 1014813 (PI’s are E. J. Seibel and A. P. Reeves). ReferencesH. Neiburg, Diagnostic Cell Pathology in Tissue and Smears, Grune & Stratton Inc., New York
(1967). Google Scholar
N. B. Atkin,
“Modal deoxyribonucleic acid value and survival in carcinoma of the breast,”
Br. Med. J., 1
(5795), 271
–272
(1972). http://dx.doi.org/10.1136/bmj.1.5795.271 BMJOAE 0007-1447 Google Scholar
N. B. AtkinR. Kay,
“Prognostic significance of modal DNA value and other factors in malignant tumors, based on 1465 cases,”
Br. J. Cancer, 40
(2), 210
–221
(1979). http://dx.doi.org/10.1038/bjc.1979.168 BJCAAI 0007-0920 Google Scholar
N. B. AtkinG. MattinsonM. C. Baker,
“A comparison of the DNA content and chromosome number of fifty human tumors,”
Br. J. Cancer, 20
(1), 87
–101
(1966). http://dx.doi.org/10.1038/bjc.1966.10 BJCAAI 0007-0920 Google Scholar
A. Kreicbergset al.,
“Cellular DNA content in human osteosarcoma: aspects on diagnosis and prognosis,”
Cancer, 50
(11), 2476
–2481
(1982). http://dx.doi.org/10.1002/(ISSN)1097-0142 60IXAH 0008-543X Google Scholar
M. Fanget al.,
“DNA abnormalities as marker of risk for progression of Barrett’s esophagus to adenocarcinoma: image cytometric DNA analysis in formalin-fixed tissues,”
Am. J. Gastroenterol., 99
(10), 1887
–1894
(2004). http://dx.doi.org/10.1111/ajg.2004.99.issue-10 AJGAAR 0002-9270 Google Scholar
G. Haroskeet al.,
“Fourth updated ESACP consensus report on diagnostic DNA image cytometry,”
Anal. Cell. Pathol., 23
(2), 89
–95
(2001). ACPAER 0921-8912 Google Scholar
D. Schmidtet al.,
“DNA analysis in hepatoblastoma by flow and image cytometry,”
Cancer, 72
(10), 2914
–2919
(1993). http://dx.doi.org/10.1002/(ISSN)1097-0142 60IXAH 0008-543X Google Scholar
Q. Huanget al.,
“DNA index determination with automated cellular imaging system (ACIS) in Barrett’s esophagus: comparison with CAS 200,”
BMC Clin. Pathol., 5 7
(2005). http://dx.doi.org/10.1186/1472-6890-5-7 BCPMB3 1472-6890 Google Scholar
A. R. Santos-Silvaet al.,
“High incidences of DNA ploidy abnormalities in tongue squamous cell carcinoma of young patients: an international collaborative study,”
Histopathology, 58
(7), 1127
–1135
(2011). http://dx.doi.org/10.1111/his.2011.58.issue-7 HISTDD 1365-2559 Google Scholar
S. C. Daiet al.,
“Automated cellular imaging system for aneuploidy differentiates chronic pancreatitis from pancreatic cancer,”
Gastroenterology, 142
(5), S
–849
(2012). GASTAB 0016-5085 Google Scholar
D. A. EllisonS. J. MaygardenD. B. Novotny,
“Quantitative DNA analysis of fresh solid tumors by flow and image cytometric methods: a comparison using the Roche Pathology Workstation Image Analyzer,”
Mod. Pathol., 8
(3), 275
–281
(1995). MODPEO 0893-3952 Google Scholar
J. M. Dunnet al.,
“Image cytometry accurately detects DNA ploidy abnormalities and predicts late relapse to high-grade dysplasia and adenocarcinoma in Barrett’s esophagus following photodynamic therapy,”
Br. J. Cancer, 102
(11), 1608
–1617
(2010). http://dx.doi.org/10.1038/sj.bjc.6605688 BJCAAI 0007-0920 Google Scholar
N. B. Atkin,
“Modal deoxyribonucleic acid value and survival in carcinoma of the breast,”
Br. Med. J., 1
(5795), 271
–272
(1972). http://dx.doi.org/10.1136/bmj.1.5795.271 BMJOAE 0007-1447 Google Scholar
A. Pinduret al.,
“DNA ploidy measurements in prostate cancer: differences between image analysis and flow cytometry and clinical implications,”
Prostate, 25
(4), 189
–198
(1994). http://dx.doi.org/10.1002/(ISSN)1097-0045 PRSTDS 1097-0045 Google Scholar
K. A. AlanenM. LintuH. Joensuu,
“Image cytometry of breast carcinomas that are DNA diploid by flow cytometry: time to revise the concept of DNA diploidy?,”
Anal. Quant. Cytol. Histol., 20
(3), 178
–186
(1998). AQCHED 0884-6812 Google Scholar
E. SchulteD. Wittekind,
“Standardization of the Papanicolaou stain. I. A comparison of five nuclear stains,”
Anal. Quant. Cytol. Histol., 12
(3), 149
–156
(1990). AQCHED 0884-6812 Google Scholar
P. S. Oudet al.,
“Thionine-Feulgen Congo Red—a new staining technique for automated cytology,”
Acta Histochem. Suppl., 24 199
–206
(1981). AHSUAV 0567-7556 Google Scholar
P. HaourC. Conti,
“Advantages and disadvantages of the Feulgen reaction and histophotometric technique as applied to cervical smears,”
Acta Cytol., 2 326
–327
(1958). ACYTAN 0001-5547 Google Scholar
J. Sharpe,
“Optical projection tomography as a tool for 3D microscopy and gene expression studies,”
Science, 296 541
–545
(2002). http://dx.doi.org/10.1126/science.1068206 SCIEAS 0036-8075 Google Scholar
T. Alanentaloet al.,
“Tomographic molecular imaging and 3D quantification within adult mouse organs,”
Nat. Methods, 4
(1), 31
–33
(2006). http://dx.doi.org/10.1038/nmeth985 1548-7091 Google Scholar
M. Oldhamet al.,
“Three-dimensional imaging of whole rodent organs using optical computed and emission tomography,”
J. Biomed. Opt., 12
(1), 014009
(2007). http://dx.doi.org/10.1117/1.2709858 JBOPFO 1083-3668 Google Scholar
F. PampaloniE. G. ReynaudE. H. K. Stelzer,
“The third dimension bridges the gap between cell culture and live tissue,”
Nat. Rev. Mol. Cell Biol., 8
(10), 839
–845
(2007). http://dx.doi.org/10.1038/nrm2236 NRMCBP 1471-0072 Google Scholar
Y. GariniB. J. VermolenI. T. Young,
“From micro to nano: recent advances in high-resolution microscopy,”
Curr. Opin. Biotechnol., 16
(1), 3
–12
(2005). http://dx.doi.org/10.1016/j.copbio.2005.01.003 CUOBE3 0958-1669 Google Scholar
M. Fauveret al.,
“Three-dimensional imaging of single isolated cell nuclei using optical projection tomography,”
Opt. Express, 13
(11), 4210
–4223
(2005). http://dx.doi.org/10.1364/OPEX.13.004210 OPEXFF 1094-4087 Google Scholar
Q. Miaoet al.,
“Multimodal 3D imaging of cells and tissue, bridging the gap between clinical and research microscopy,”
Ann. Biomed. Eng., 40
(2), 263
–276
(2012). http://dx.doi.org/10.1007/s10439-011-0411-5 ABMECF 0090-6964 Google Scholar
M. G. Meyeret al.,
“Automated cell analysis in 2D and 3D: a comparative study,”
Pattern Recognit., 42
(1), 141
–146
(2009). http://dx.doi.org/10.1016/j.patcog.2008.06.018 PTNRA8 0031-3203 Google Scholar
A. Jakobsen,
“The use of trout erythrocytes and human lymphocytes for standardization in flow cytometry,”
Cytometry, 4
(2), 161
–165
(1983). http://dx.doi.org/10.1002/(ISSN)1097-0320 CYTODQ 0196-4763 Google Scholar
J. PierrezX. Ronot,
“Use of diploid and triploid trout erythrocytes as internal standards in flow cytometry,”
Cytometry, 12
(3), 275
–278
(1991). http://dx.doi.org/10.1002/(ISSN)1097-0320 CYTODQ 0196-4763 Google Scholar
G. H. Thorgaardet al.,
“Triploid rainbow trout identified by flow cytometry,”
Aquaculture, 29
(3–4), 305
–309
(1982). http://dx.doi.org/10.1016/0044-8486(82)90144-2 AQCLAL 0044-8486 Google Scholar
L. L. VindeløvI. J. ChristensenN. I. Nissen,
“Standardization of high-resolution flow cytometric DNA analysis by the simultaneous use of chicken and trout red blood cells as internal reference standards,”
Cytometry, 3
(5), 328
–331
(1983). http://dx.doi.org/10.1002/(ISSN)1097-0320 CYTODQ 0196-4763 Google Scholar
E. SchulteD. Wittekind,
“Standardized thionin-eosin stain in bronchial cytology. A substitute for hematoxylin-eosin Y staining,”
Anal. Quant. Cytol. Histol., 11
(2), 131
–139
(1989). AQCHED 0884-6812 Google Scholar
E. K. SchulteD. H. Wittekind,
“Standardized thionin-eosin Y: a quick stain for cytology,”
Stain Technol., 64
(5), 255
–256
(1989). STTEAW 0038-9153 Google Scholar
D. Wittekindet al.,
“Influence of staining on fast-automated cell segmentation, feature extraction and cell image analysis,”
Anal. Quant. Cytol., 5
(1), 55
–60
(1983). Google Scholar
The Rabinovitch laboratory: Department of Pathology, University of Washington, “Flow Cytometry Facility,”
(2013) http://www.pathology.washington.edu/research/labs/rabinovitch/flowroom/protocols.php?p=1 December ). 2013). Google Scholar
P. S. Rabinovitch,
“DNA content histogram and cell-cycle analysis,”
Methods Cell Biol., 41 263
–296
(1994). http://dx.doi.org/10.1016/S0091-679X(08)61723-9 MCBLAG 0091-679X Google Scholar
N. Agarwalet al.,
“Quantification of relative chromatin content in flow cytometry standards using 3D OPTM imaging technique,”
Proc. SPIE, 8676 86760T
(2013). http://dx.doi.org/10.1117/12.2007281 PSISDG 0277-786X Google Scholar
E. K. Schulte,
“Standardization of the Feulgen reaction for absorption DNA image cytometry: a review,”
Anal. Cell Pathol., 3
(3), 167
–182
(1991). Google Scholar
E. K. SchulteD. H. Wittekind,
“Standardization of the Feulgen reaction: the influence of chromatin condensation on the kinetics of acid hydrolysis,”
Anal. Cell Pathol., 2
(3), 149
–157
(1990). Google Scholar
E. SchulteD. Wittekind,
“Standardization of the Feulgen-Schiff technique. Staining characteristics of pure fuchsin dyes; a cytophotometric investigation,”
Histochemistry, 91
(4), 321
–331
(1989). http://dx.doi.org/10.1007/BF00493008 HCMYAL 0301-5564 Google Scholar
R. FeulgenH. Rossenbeck,
“Mikroskopisch-chemischer Nachweis einer Nukleinsäure von Typus der Thymonuklein- säure und die darauf beruhende selektive Färbung von Zellkernen in mikroskopischen Präparaten,”
Hoppe-Seylers Z Physiol. Chem., 135 203
–248
(1924). http://dx.doi.org/10.1515/bchm2.1924.135.5-6.203 0006-3169 Google Scholar
A. BöckingF. GiroudA. Reith,
“Consensus report of the ESACP task force on standardization of diagnostic DNA image cytometry,”
Anal. Cell Pathol., 8
(1), 67
–74
(1995). Google Scholar
R. T. AllisonH. A. Sanders,
“Thionin: spectrophotometry and thin-layer chromatography in relation to biological staining,”
Med. Lab. Sci., 42
(3), 213
–220
(1985). MLASDU 0308-3616 Google Scholar
A. C. KakM. Slaney, Principles of Computerized Tomographic Imaging, IEEE Press, New York
(1988). Google Scholar
Y. XieA. P. Reeves,
“Single 3D cell segmentation from optical CT microscope images,”
Proc. SPIE, 9034 90343B
(2014). http://dx.doi.org/10.1117/12.2043852 PSISDG 0277-786X Google Scholar
R. Deriche,
“Using Canny’s criteria to derive a recursively implemented optimal edge detector,”
IJCV, 1
(2), 167
–187
(1987). http://dx.doi.org/10.1007/BF00123164 IJCVEQ 0920-5691 Google Scholar
O. MongaR. DericheJ. M. Rocchisani,
“3D edge detection using recursive filtering: application to scanner images,”
CVGIP: Image Underst., 53
(1), 76
–87
(1991). http://dx.doi.org/10.1016/1049-9660(91)90006-B CIUNEJ 1049-9660 Google Scholar
A. P. Reeves,
“Cornel University vision and image analysis group,”
(2013) http://www.via.cornell.edu/visionx/ December ). 2013). Google Scholar
P. MarcelloG. Kimberlee, Principles of Biostatistics, 263
–265 Wadsworth Publishing Company, California
(1993). Google Scholar
R. G. Miller, Simultaneous Statistical Inference, 6
–8 2nd ed.Springer Verlag, New York
(1981). Google Scholar
P. ChiecoM. Derenzini,
“The Feulgen reaction 75 years on,”
Histochem. Cell Biol., 111
(5), 345
–358
(1999). http://dx.doi.org/10.1007/s004180050367 HCBIFP 0948-6143 Google Scholar
S. Biesterfeldet al.,
“Feulgen staining remains the gold standard for precise DNA image cytometry,”
Anticancer Res., 31
(1), 53
–58
(2011). ANTRD4 0250-7005 Google Scholar
A. M. Gurleyet al.,
“Comparison of the Papanicolaou and Feulgen staining methods for DNA quantification by image analysis,”
Cytometry, 11
(4), 468
–474
(1990). http://dx.doi.org/10.1002/(ISSN)1097-0320 CYTODQ 0196-4763 Google Scholar
M. A. C. MendoncaC. R. CarvalhoW. R. Clarindo,
“DNA content differences between male and female chicken (Gallus gallus domesticus) nuclei and Z and W chromosomes resolved by image cytometry,”
J. Histochem. Cytochem., 58
(3), 229
–235
(2010). http://dx.doi.org/10.1369/jhc.2009.954727 JHCYAS 0022-1554 Google Scholar
L. L. VindeløvI. J. ChristensenN. I. Nissen,
“Standardization of high-resolution flow cytometric DNA analysis by the simultaneous use of chicken and trout red blood cells as internal reference standards,”
Cytometry, 3
(5), 328
–331
(1983). http://dx.doi.org/10.1002/(ISSN)1097-0320 CYTODQ 0196-4763 Google Scholar
E. Bribiesca,
“A measure of compactness for 3D shapes,”
Comput. Math. Appl., 40
(10–11), 1275
–1284
(2000). http://dx.doi.org/10.1016/S0898-1221(00)00238-8 CMAPDK 0898-1221 Google Scholar
R. L. CoeE. J. Seibel,
“Experimental and theoretical analysis for improved microscope design of optical projection tomographic microscopy,”
Opt. Lett., 38
(17), 3398
–3401
(2013). http://dx.doi.org/10.1364/OL.38.003398 OPLEDP 0146-9592 Google Scholar
D. A. Basijiet al.,
“Cellular image analysis and imaging by flow cytometry,”
Clin. Lab. Med., 27
(3), 653
–670
(2007). http://dx.doi.org/10.1016/j.cll.2007.05.008 CLMED6 0272-2712 Google Scholar
K. Godaet al.,
“High-throughput single-microparticle imaging flow analyzer,”
Proc. Natl. Acad. Sci., 109
(29), 11630
–11635
(2012). http://dx.doi.org/10.1073/pnas.1204718109 PMASAX 0096-9206 Google Scholar
A. Nelsonet al.,
“Non-invasive Detection of Lung Cancer from Cells in Sputum using Cell-CT™,”
J. Clin. Oncol., 32
(5), 7547
(2013). Google Scholar
T. Irinopoulouet al.,
“Three-dimensional DNA image cytometry by confocal scanning laser microscopy in thick tissue blocks of prostatic lesions,”
Cytometry, 27
(2), 99
–105
(1997). http://dx.doi.org/10.1002/(ISSN)1097-0320 CYTODQ 0196-4763 Google Scholar
J. P. Rigautet al.,
“Three-dimensional DNA image cytometry by confocal scanning laser microscopy in thick tissue blocks,”
Cytometry, 12
(6), 511
–524
(1991). http://dx.doi.org/10.1002/(ISSN)1097-0320 CYTODQ 0196-4763 Google Scholar
N. Wanget al.,
“Fluorescence image cytometry for measurement of nuclear DNA content in surgical pathology,”
Cytometry, 22
(4), 323
–329
(1995). http://dx.doi.org/10.1002/(ISSN)1097-0320 CYTODQ 0196-4763 Google Scholar
R. A. KempD. M. ReindersB. Turic,
“Detection of lung cancer by automated sputum cytometry,”
J. Thorac. Oncol., 2
(11), 993
–1000
(2007). http://dx.doi.org/10.1097/JTO.0b013e318158d488 JTOOB7 1556-0864 Google Scholar
P. S. Kraemeret al.,
“Flow cytometric enrichment for respiratory epithelial cells in sputum,”
Cytometry A, 60
(1), 1
–7
(2004). http://dx.doi.org/10.1002/(ISSN)1097-0320 1552-4922 Google Scholar
A. P. Reeveset al.,
“Nuclear cytoplasmic cell evaluation from 3D optical CT microscope images,”
Proc. SPIE, 8315 83153C
(2012). http://dx.doi.org/10.1117/12.912399 PSISDG 0277-786X Google Scholar
BiographyNitin Agarwal is an algorithm developer at VisionGate Inc. He received his BE in electrical engineering from Birla Institute of Technology Pilani Sciences, Rajasthan, India, in 2010 and MS from University of Washington, Seattle, in bioengineering in 2013. His research interests include, but are not limited to, quantitative medical imaging, medical image analysis, and three-dimensional reconstruction. He is a member of SPIE. Alberto M. Biancardi is a visiting scientist at Cornell University. He received his BS in mathematics and PhD in computer engineering from University of Pavia, Italy. He has been a postdoc visitor at University of Paris XI and an assistant professor at University of Pavia, Italy. His research interests are mainly in the areas of biomedical image analysis, both two-dimensional and three-dimensional. He is a member of SPIE. Florence W. Patten received her BS (general science) degree from the University of Oregon, Eugene, Oregon, MT(ASCP) in medical technology from the University of Oregon Medical School, Portland, Oregon, and CT(ASCP) in cytotechnology from the University of Oregon Medical School, Portland, Oregon. She previously was the vice president for clinical affairs in VisionGate Inc.; however, she is currently retired. Anthony P. Reeves is a professor in School of Electrical & Computer Engineering and director of Vision & Image Analysis group at Cornell University. He received his BS and PhD in electrical engineering from University of Kent at Canterbury, United Kingdom. His research interests include developing computer methods for analyzing digital images, especially with regard to accurate image measurements and with a primary focus on biomedical applications. He is a member of SPIE. Eric J. Seibel is a research professor of mechanical engineering, adjunct in bioengineering and electrical engineering, and director of the Human Photonics Laboratory at the University of Washington. He received his BS and MS in mechanical engineering from Cornell University and University of California, Berkeley, respectively, and his PhD in bioengineering from University of Washington, Seattle. He invented the scanning fiber endoscopy and develops novel instrumentation techniques for early disease diagnosis. He is a member of SPIE. |